Lab 2: Ensembles of Trees

Author

Alex Sánchez, Esteban Vegas and Ferran Reeverter

Published

March 24, 2025

Code
# Helper packages
library(dplyr)       # for data wrangling
library(ggplot2)     # for awesome plotting
library(modeldata)  # for parallel backend to foreach
library(foreach)     # for parallel processing with for loops

# Modeling packages
#library(caret)       # for general model fitting
library(rpart)       # for fitting decision trees
library(ipred)       # for fitting bagged decision trees

Introduction

This lab presents some examples on building ensemble predictors with a variety of methods.

In order to facilitate the comparison between methods and tools the same prediction problem will be solved with distinct methods and distinct parameter settings.

We will work with the AmesHousing dataset, a dataset with multiple variables about housing in Ames, IA. Our goal is to predict the sales prices stored in the Sale_Price variable.

The dataset

Packge AmesHousing contains the data jointly with some instructions to create the required dataset.

We will use, however data from the modeldata package where some preprocessing of the data has already been performed (see: https://www.tmwr.org/ames)

Code
data(ames, package = "modeldata")
dim(ames)
[1] 2930   74

Exploratory Data Analysis an preprocessing

The dataset has 74 variables, and has already been prepared by the package modeldatamaintainers.

In any case it is always recommended to do some Exploratory Analysis.

Code
library(skimr)
skim(ames)
Data summary
Name ames
Number of rows 2930
Number of columns 74
_______________________
Column type frequency:
factor 40
numeric 34
________________________
Group variables None

Variable type: factor

skim_variable n_missing complete_rate ordered n_unique top_counts
MS_SubClass 0 1 FALSE 16 One: 1079, Two: 575, One: 287, One: 192
MS_Zoning 0 1 FALSE 7 Res: 2273, Res: 462, Flo: 139, Res: 27
Street 0 1 FALSE 2 Pav: 2918, Grv: 12
Alley 0 1 FALSE 3 No_: 2732, Gra: 120, Pav: 78
Lot_Shape 0 1 FALSE 4 Reg: 1859, Sli: 979, Mod: 76, Irr: 16
Land_Contour 0 1 FALSE 4 Lvl: 2633, HLS: 120, Bnk: 117, Low: 60
Utilities 0 1 FALSE 3 All: 2927, NoS: 2, NoS: 1
Lot_Config 0 1 FALSE 5 Ins: 2140, Cor: 511, Cul: 180, FR2: 85
Land_Slope 0 1 FALSE 3 Gtl: 2789, Mod: 125, Sev: 16
Neighborhood 0 1 FALSE 28 Nor: 443, Col: 267, Old: 239, Edw: 194
Condition_1 0 1 FALSE 9 Nor: 2522, Fee: 164, Art: 92, RRA: 50
Condition_2 0 1 FALSE 8 Nor: 2900, Fee: 13, Art: 5, Pos: 4
Bldg_Type 0 1 FALSE 5 One: 2425, Twn: 233, Dup: 109, Twn: 101
House_Style 0 1 FALSE 8 One: 1481, Two: 873, One: 314, SLv: 128
Overall_Cond 0 1 FALSE 9 Ave: 1654, Abo: 533, Goo: 390, Ver: 144
Roof_Style 0 1 FALSE 6 Gab: 2321, Hip: 551, Gam: 22, Fla: 20
Roof_Matl 0 1 FALSE 8 Com: 2887, Tar: 23, WdS: 9, WdS: 7
Exterior_1st 0 1 FALSE 16 Vin: 1026, Met: 450, HdB: 442, Wd : 420
Exterior_2nd 0 1 FALSE 17 Vin: 1015, Met: 447, HdB: 406, Wd : 397
Mas_Vnr_Type 0 1 FALSE 5 Non: 1775, Brk: 880, Sto: 249, Brk: 25
Exter_Cond 0 1 FALSE 5 Typ: 2549, Goo: 299, Fai: 67, Exc: 12
Foundation 0 1 FALSE 6 PCo: 1310, CBl: 1244, Brk: 311, Sla: 49
Bsmt_Cond 0 1 FALSE 6 Typ: 2616, Goo: 122, Fai: 104, No_: 80
Bsmt_Exposure 0 1 FALSE 5 No: 1906, Av: 418, Gd: 284, Mn: 239
BsmtFin_Type_1 0 1 FALSE 7 GLQ: 859, Unf: 851, ALQ: 429, Rec: 288
BsmtFin_Type_2 0 1 FALSE 7 Unf: 2499, Rec: 106, LwQ: 89, No_: 81
Heating 0 1 FALSE 6 Gas: 2885, Gas: 27, Gra: 9, Wal: 6
Heating_QC 0 1 FALSE 5 Exc: 1495, Typ: 864, Goo: 476, Fai: 92
Central_Air 0 1 FALSE 2 Y: 2734, N: 196
Electrical 0 1 FALSE 6 SBr: 2682, Fus: 188, Fus: 50, Fus: 8
Functional 0 1 FALSE 8 Typ: 2728, Min: 70, Min: 65, Mod: 35
Garage_Type 0 1 FALSE 7 Att: 1731, Det: 782, Bui: 186, No_: 157
Garage_Finish 0 1 FALSE 4 Unf: 1231, RFn: 812, Fin: 728, No_: 159
Garage_Cond 0 1 FALSE 6 Typ: 2665, No_: 159, Fai: 74, Goo: 15
Paved_Drive 0 1 FALSE 3 Pav: 2652, Dir: 216, Par: 62
Pool_QC 0 1 FALSE 5 No_: 2917, Exc: 4, Goo: 4, Typ: 3
Fence 0 1 FALSE 5 No_: 2358, Min: 330, Goo: 118, Goo: 112
Misc_Feature 0 1 FALSE 6 Non: 2824, She: 95, Gar: 5, Oth: 4
Sale_Type 0 1 FALSE 10 WD : 2536, New: 239, COD: 87, Con: 26
Sale_Condition 0 1 FALSE 6 Nor: 2413, Par: 245, Abn: 190, Fam: 46

Variable type: numeric

skim_variable n_missing complete_rate mean sd p0 p25 p50 p75 p100 hist
Lot_Frontage 0 1 57.65 33.50 0.00 43.00 63.00 78.00 313.00 ▇▇▁▁▁
Lot_Area 0 1 10147.92 7880.02 1300.00 7440.25 9436.50 11555.25 215245.00 ▇▁▁▁▁
Year_Built 0 1 1971.36 30.25 1872.00 1954.00 1973.00 2001.00 2010.00 ▁▂▃▆▇
Year_Remod_Add 0 1 1984.27 20.86 1950.00 1965.00 1993.00 2004.00 2010.00 ▅▂▂▃▇
Mas_Vnr_Area 0 1 101.10 178.63 0.00 0.00 0.00 162.75 1600.00 ▇▁▁▁▁
BsmtFin_SF_1 0 1 4.18 2.23 0.00 3.00 3.00 7.00 7.00 ▃▂▇▁▇
BsmtFin_SF_2 0 1 49.71 169.14 0.00 0.00 0.00 0.00 1526.00 ▇▁▁▁▁
Bsmt_Unf_SF 0 1 559.07 439.54 0.00 219.00 465.50 801.75 2336.00 ▇▅▂▁▁
Total_Bsmt_SF 0 1 1051.26 440.97 0.00 793.00 990.00 1301.50 6110.00 ▇▃▁▁▁
First_Flr_SF 0 1 1159.56 391.89 334.00 876.25 1084.00 1384.00 5095.00 ▇▃▁▁▁
Second_Flr_SF 0 1 335.46 428.40 0.00 0.00 0.00 703.75 2065.00 ▇▃▂▁▁
Gr_Liv_Area 0 1 1499.69 505.51 334.00 1126.00 1442.00 1742.75 5642.00 ▇▇▁▁▁
Bsmt_Full_Bath 0 1 0.43 0.52 0.00 0.00 0.00 1.00 3.00 ▇▆▁▁▁
Bsmt_Half_Bath 0 1 0.06 0.25 0.00 0.00 0.00 0.00 2.00 ▇▁▁▁▁
Full_Bath 0 1 1.57 0.55 0.00 1.00 2.00 2.00 4.00 ▁▇▇▁▁
Half_Bath 0 1 0.38 0.50 0.00 0.00 0.00 1.00 2.00 ▇▁▅▁▁
Bedroom_AbvGr 0 1 2.85 0.83 0.00 2.00 3.00 3.00 8.00 ▁▇▂▁▁
Kitchen_AbvGr 0 1 1.04 0.21 0.00 1.00 1.00 1.00 3.00 ▁▇▁▁▁
TotRms_AbvGrd 0 1 6.44 1.57 2.00 5.00 6.00 7.00 15.00 ▁▇▂▁▁
Fireplaces 0 1 0.60 0.65 0.00 0.00 1.00 1.00 4.00 ▇▇▁▁▁
Garage_Cars 0 1 1.77 0.76 0.00 1.00 2.00 2.00 5.00 ▅▇▂▁▁
Garage_Area 0 1 472.66 215.19 0.00 320.00 480.00 576.00 1488.00 ▃▇▃▁▁
Wood_Deck_SF 0 1 93.75 126.36 0.00 0.00 0.00 168.00 1424.00 ▇▁▁▁▁
Open_Porch_SF 0 1 47.53 67.48 0.00 0.00 27.00 70.00 742.00 ▇▁▁▁▁
Enclosed_Porch 0 1 23.01 64.14 0.00 0.00 0.00 0.00 1012.00 ▇▁▁▁▁
Three_season_porch 0 1 2.59 25.14 0.00 0.00 0.00 0.00 508.00 ▇▁▁▁▁
Screen_Porch 0 1 16.00 56.09 0.00 0.00 0.00 0.00 576.00 ▇▁▁▁▁
Pool_Area 0 1 2.24 35.60 0.00 0.00 0.00 0.00 800.00 ▇▁▁▁▁
Misc_Val 0 1 50.64 566.34 0.00 0.00 0.00 0.00 17000.00 ▇▁▁▁▁
Mo_Sold 0 1 6.22 2.71 1.00 4.00 6.00 8.00 12.00 ▅▆▇▃▃
Year_Sold 0 1 2007.79 1.32 2006.00 2007.00 2008.00 2009.00 2010.00 ▇▇▇▇▃
Sale_Price 0 1 180796.06 79886.69 12789.00 129500.00 160000.00 213500.00 755000.00 ▇▇▁▁▁
Longitude 0 1 -93.64 0.03 -93.69 -93.66 -93.64 -93.62 -93.58 ▅▅▇▆▁
Latitude 0 1 42.03 0.02 41.99 42.02 42.03 42.05 42.06 ▂▂▇▇▇

The exploration shows that the data set is well formed with factor data types for categorical variables and no missings.

It can also be seen that tha response variabl, Sales_Price varies on a high range, as confirmed below.

Code
summary(ames$Sale_Price)
   Min. 1st Qu.  Median    Mean 3rd Qu.    Max. 
  12789  129500  160000  180796  213500  755000 
Code
boxplot(ames[,sapply(ames, is.numeric)], las=2, cex.axis=0.5)

Although not strictly necessary, given that the variable that has the widest range of variation is the variable to predict we can consider transforming it. In this case the simplest transform seems to express the price in thousands instead of dollars. The distribution of the variable is asymetrical so we may also consider taking logarithm, but given that it would complicate the interpretation of the results, and that something like normality is not required by the methods we use, only division by 1000 is performed.

Code
require(dplyr)
ames <- ames %>% mutate(Sale_Price = Sale_Price/1000)
boxplot(ames)

Spliting the data into test/train

We split the data in separate test / training sets and do it in such a way that samplig is balanced for the response variable, Sale_Price.

Code
if(!require(rsample))
  install.packages("rsample", dep=TRUE)
# Stratified sampling with the rsample package
set.seed(123)
split <- rsample::initial_split(ames, prop = 0.7, 
                       strata = "Sale_Price")
ames_train  <- training(split)
ames_test   <- testing(split)

A simple regression tree

As a first attempt to predict Sales_Price we build a unique regression tree, which as has been discussed is a weak learner. The tree package will be used to fit and optimize the tree.

We build a tree using non-restrictive parameters. This will allow space for pruning it better.

We use the tree.control function to set the values for the control parameter in the tree function.

Let’s start with a tree with the default values.

Code
library(tree)

ctlPars <-tree.control(nobs =nrow(ames_train), 
                       mincut = 5, 
                       minsize = 10, 
                       mindev = 0.01)

ames_rt1 <-  tree::tree(
                    formula = Sale_Price ~ .,
                    data    = ames_train,
                    split   = "deviance",
                    control = ctlPars)
summary(ames_rt1)

Regression tree:
tree::tree(formula = Sale_Price ~ ., data = ames_train, control = ctlPars, 
    split = "deviance")
Variables actually used in tree construction:
[1] "Neighborhood"  "First_Flr_SF"  "Gr_Liv_Area"   "Total_Bsmt_SF"
[5] "Second_Flr_SF"
Number of terminal nodes:  12 
Residual mean deviance:  1428 = 2909000 / 2037 
Distribution of residuals:
     Min.   1st Qu.    Median      Mean   3rd Qu.      Max. 
-227.1000  -21.2400   -0.2372    0.0000   19.0800  212.0000 

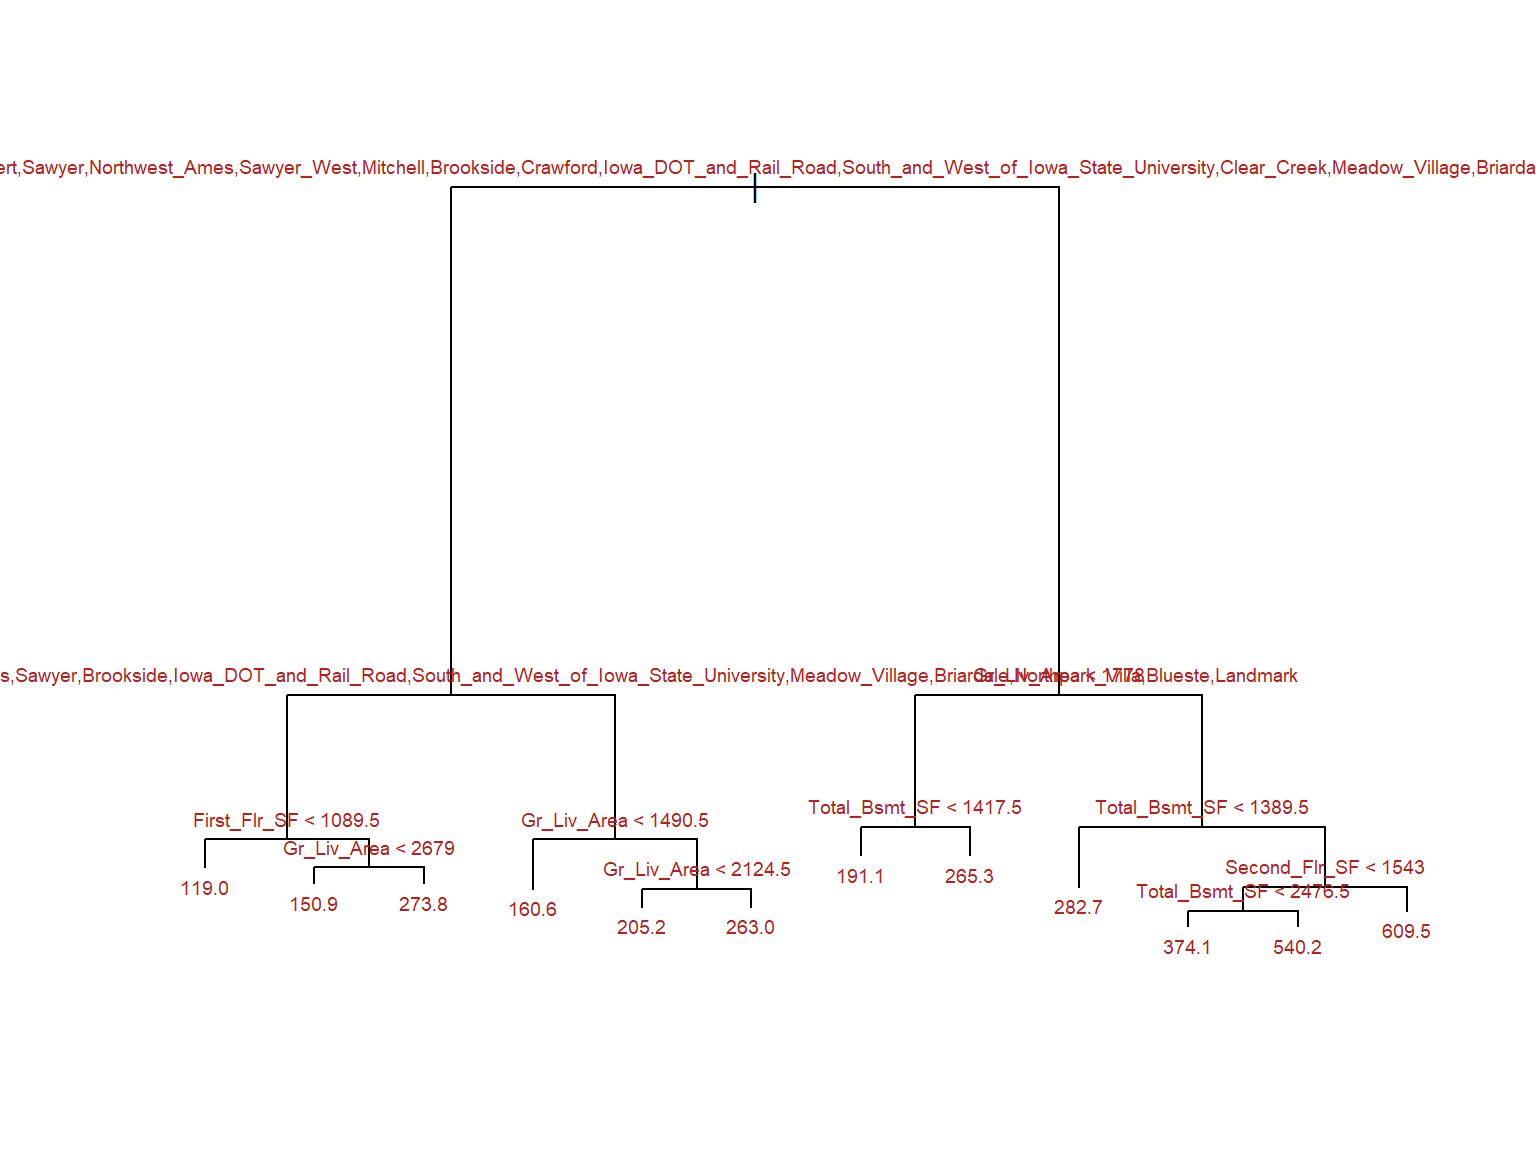
This gives a small tree with only 11 terminal nodes.

We can visualize the tree

Code
plot(x = ames_rt1, type = "proportional")
text(x = ames_rt1, splits = TRUE, pretty = 0, cex = 0.6, col = "firebrick")

If instead of using the treepackage we use rpart we can get a better plot:

Code
ames_rt1bis <- rpart(
  formula = Sale_Price ~ .,
  data    = ames_train,
  method  = "anova",
  control = ctlPars
)
library(rpart.plot)
rpart.plot(ames_rt1bis)

Optimizing the tree

In order to optimize the tree we ccan ompute the best cost complexity value

Code
set.seed(123)
cv_ames_rt1 <- tree::cv.tree(ames_rt1, K = 5)

optSize <- rev(cv_ames_rt1$size)[which.min(rev(cv_ames_rt1$dev))]
paste("Optimal size obtained is:", optSize)
[1] "Optimal size obtained is: 12"

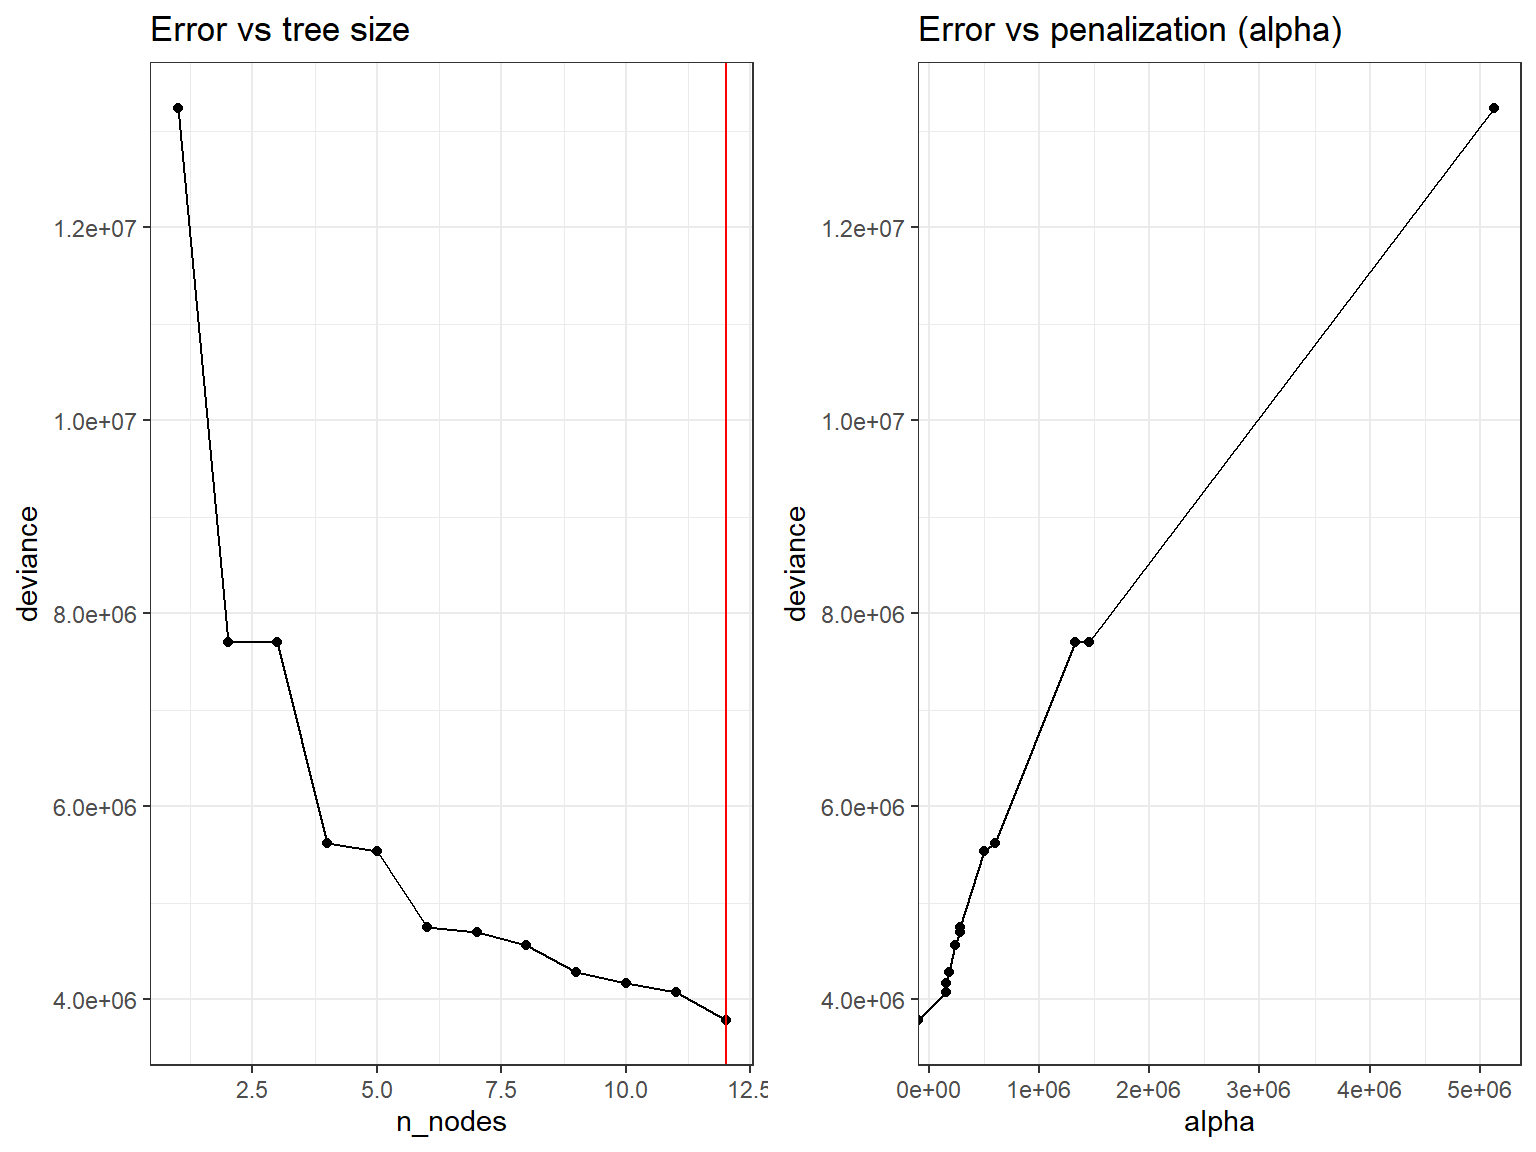
The best value of alpha is obtained with the same tree, which suggests that there will be no advantage in pruning.

This is confirmed by plotting tree size vs deviance which shows that the tree with the samllest error is the biggest one that can be obtained.

Code
library(ggplot2)
library(ggpubr)

resultados_cv <- data.frame(
                   n_nodes  = cv_ames_rt1$size,
                   deviance = cv_ames_rt1$dev,
                   alpha    = cv_ames_rt1$k
                 )

p1 <- ggplot(data = resultados_cv, aes(x = n_nodes, y = deviance)) +
      geom_line() + 
      geom_point() +
      geom_vline(xintercept = optSize, color = "red") +
      labs(title = "Error vs tree size") +
      theme_bw() 
  
p2 <- ggplot(data = resultados_cv, aes(x = alpha, y = deviance)) +
      geom_line() + 
      geom_point() +
      labs(title = "Error vs penalization (alpha)") +
      theme_bw() 

ggarrange(p1, p2)

We could have tried to obtain a bigger tree with the hope that pruning might find a better tree. This can be done setting the tree parameters to minimal values.

Code
ctlPars2 <-tree.control(nobs=nrow(ames_train), mincut = 1, minsize = 2, mindev = 0)
ames_rt2 <-  tree::tree(
                    formula = Sale_Price ~ .,
                    data    = ames_train,
                    split   = "deviance",
                    control = ctlPars2)
summary(ames_rt2)

Regression tree:
tree::tree(formula = Sale_Price ~ ., data = ames_train, control = ctlPars2, 
    split = "deviance")
Variables actually used in tree construction:
 [1] "Neighborhood"   "First_Flr_SF"   "Garage_Cond"    "Gr_Liv_Area"   
 [5] "Central_Air"    "Garage_Area"    "Enclosed_Porch" "Lot_Area"      
 [9] "Longitude"      "Latitude"       "MS_SubClass"    "Lot_Frontage"  
[13] "Overall_Cond"   "Year_Built"     "MS_Zoning"      "Alley"         
[17] "Fireplaces"     "House_Style"    "BsmtFin_Type_1" "Bsmt_Exposure" 
[21] "Bsmt_Unf_SF"    "Electrical"     "Year_Remod_Add" "Exterior_1st"  
[25] "Open_Porch_SF"  "Exterior_2nd"   "Functional"     "Mo_Sold"       
[29] "Total_Bsmt_SF"  "Bsmt_Full_Bath" "Sale_Condition" "Heating_QC"    
[33] "Mas_Vnr_Area"   "Garage_Cars"    "Land_Contour"   "Condition_1"   
[37] "Mas_Vnr_Type"   "Second_Flr_SF"  "Lot_Config"     "Exter_Cond"    
[41] "Fence"          "Lot_Shape"      "Bsmt_Cond"      "Bedroom_AbvGr" 
[45] "Wood_Deck_SF"   "Roof_Style"     "Sale_Type"      "BsmtFin_Type_2"
[49] "Bldg_Type"      "Garage_Type"    "Year_Sold"      "Garage_Finish" 
[53] "Screen_Porch"   "Half_Bath"      "Foundation"     "BsmtFin_SF_1"  
[57] "Full_Bath"      "Land_Slope"     "TotRms_AbvGrd" 
Number of terminal nodes:  1222 
Residual mean deviance:  2.579 = 2133 / 827 
Distribution of residuals:
   Min. 1st Qu.  Median    Mean 3rd Qu.    Max. 
 -2.750  -0.500   0.000   0.000   0.500   2.943 

This bigger tree has indeed a smaller deviance but pruning provides no benefit:

Code
set.seed(123)
cv_ames_rt2 <- tree::cv.tree(ames_rt2, K = 5)

optSize2 <- rev(cv_ames_rt2$size)[which.min(rev(cv_ames_rt2$dev))]
paste("Optimal size obtained is:", optSize2)
[1] "Optimal size obtained is: 12"
Code
prunedTree2 <- tree::prune.tree(
                  tree = ames_rt2,
                  best = optSize2
               )
summary(prunedTree2)

Regression tree:
snip.tree(tree = ames_rt2, nodes = c(61L, 31L, 12L, 13L, 60L, 
18L, 19L, 14L, 23L, 10L, 22L, 8L))
Variables actually used in tree construction:
[1] "Neighborhood"  "First_Flr_SF"  "Gr_Liv_Area"   "Total_Bsmt_SF"
[5] "Second_Flr_SF"
Number of terminal nodes:  12 
Residual mean deviance:  1428 = 2909000 / 2037 
Distribution of residuals:
     Min.   1st Qu.    Median      Mean   3rd Qu.      Max. 
-227.1000  -21.2400   -0.2372    0.0000   19.0800  212.0000 
Code
res_cv2 <- data.frame(
                   n_nodes  = cv_ames_rt2$size,
                   deviance = cv_ames_rt2$dev,
                   alpha    = cv_ames_rt2$k
                 )

p1 <- ggplot(data = res_cv2, aes(x = n_nodes, y = deviance)) +
      geom_line() + 
      geom_point() +
      geom_vline(xintercept = optSize2, color = "red") +
      labs(title = "Error vs tree size") +
      theme_bw() 
  
p2 <- ggplot(data = res_cv2, aes(x = alpha, y = deviance)) +
      geom_line() + 
      geom_point() +
      labs(title = "Error vs penalization (alpha)") +
      theme_bw() 

ggarrange(p1, p2)

The performance of the trees is hardly different between small or big tree in pruned or non-pruned version.

Code
ames_rt_pred1 <- predict(ames_rt1, newdata = ames_test)
test_rmse1    <- sqrt(mean((ames_rt_pred1 - ames_test$Sale_Price)^2))
paste("Error test (rmse) for initial tree:", round(test_rmse1,2))
[1] "Error test (rmse) for initial tree: 39.69"
Code
ames_rt_pred2 <- predict(ames_rt2, newdata = ames_test)
test_rmse2    <- sqrt(mean((ames_rt_pred2 - ames_test$Sale_Price)^2))
paste("Error test (rmse) for big tree:", round(test_rmse2,2))
[1] "Error test (rmse) for big tree: 37.59"
Code
ames_pruned_pred <- predict(prunedTree2, newdata = ames_test)
test_rmse3    <- sqrt(mean((ames_pruned_pred - ames_test$Sale_Price)^2))
paste("Error test (rmse) for pruned tree:", round(test_rmse3,2))
[1] "Error test (rmse) for pruned tree: 39.69"
Code
improvement <- (test_rmse3-test_rmse2)/test_rmse2*100

The MSE for each model will be saved to facilitate comparison with other models

Code
errTable <- data.frame(Model=character(),  RMSE=double())
errTable[1, ] <-  c("Default Regression Tree", round(test_rmse1,2))
errTable[2, ] <-  c("Big Regression Tree", round(test_rmse2,2))
errTable[3, ] <-  c("Optimally pruned Regression Tree", round(test_rmse3,2))
Code
# kableExtra::kable(errTable) %>% kableExtra::kable_styling()
knitr::kable(errTable) 
Model RMSE
Default Regression Tree 39.69
Big Regression Tree 37.59
Optimally pruned Regression Tree 39.69

In summary, what is illustrated by this example is that, for some datasets, it is very hard to obtain an optimal tree because there seems to be a minimum complexity which is very hard to decrease.

Building a saturated tree only provides a slight improvement of less than 5% in RMSE at the cost of having to use 5 times more variables in a tree withh more than 1000 nodes.

This is a good point to consider using an ensemble instead of single trees.

Feature interpretation

To measure feature importance, the reduction in the loss function (e.g., SSE) attributed to each variable at each split is tabulated.

In some instances, a single variable could be used multiple times in a tree; consequently, the total reduction in the loss function across all splits by a variable are summed up and used as the total feature importance.

Not all packages store the informaticon required to compute variable importance. For instance, the treepackges does not, but rpartor caret do save it.

Code
vip(ames_rt1bis, num_features = 40, bar = FALSE)

Bagging trees

The first attempt to build an ensemble may be to apply bagging that is building multiple trees from a set of resamples and averaging the predictions of each tree.

In this example, rather than use a single pruned decision tree, we can use, say, 100 bagged unpruned trees (by not pruning the trees we’re keeping bias low and variance high which is when bagging will have the biggest effect).

Bagging is equivalent to RandomForest if we use all the trees so the library randomForest is used.

Code
# make bootstrapping reproducible
set.seed(123)

library(randomForest)
bag.Ames <- randomForest(Sale_Price ~ ., 
                         data = ames_train, 
                         mtry = ncol(ames_train-1), 
                         ntree = 100,
                         importance = TRUE)
show(bag.Ames)

Call:
 randomForest(formula = Sale_Price ~ ., data = ames_train, mtry = ncol(ames_train -      1), ntree = 100, importance = TRUE) 
               Type of random forest: regression
                     Number of trees: 100
No. of variables tried at each split: 73

          Mean of squared residuals: 737.1328
                    % Var explained: 88.57

Bagging, as most ensemble procedures, can be time consuming. See Boehmke and Greenwell (2020) for an example on how to easily parallelize code, and save time.

Distinct error rates

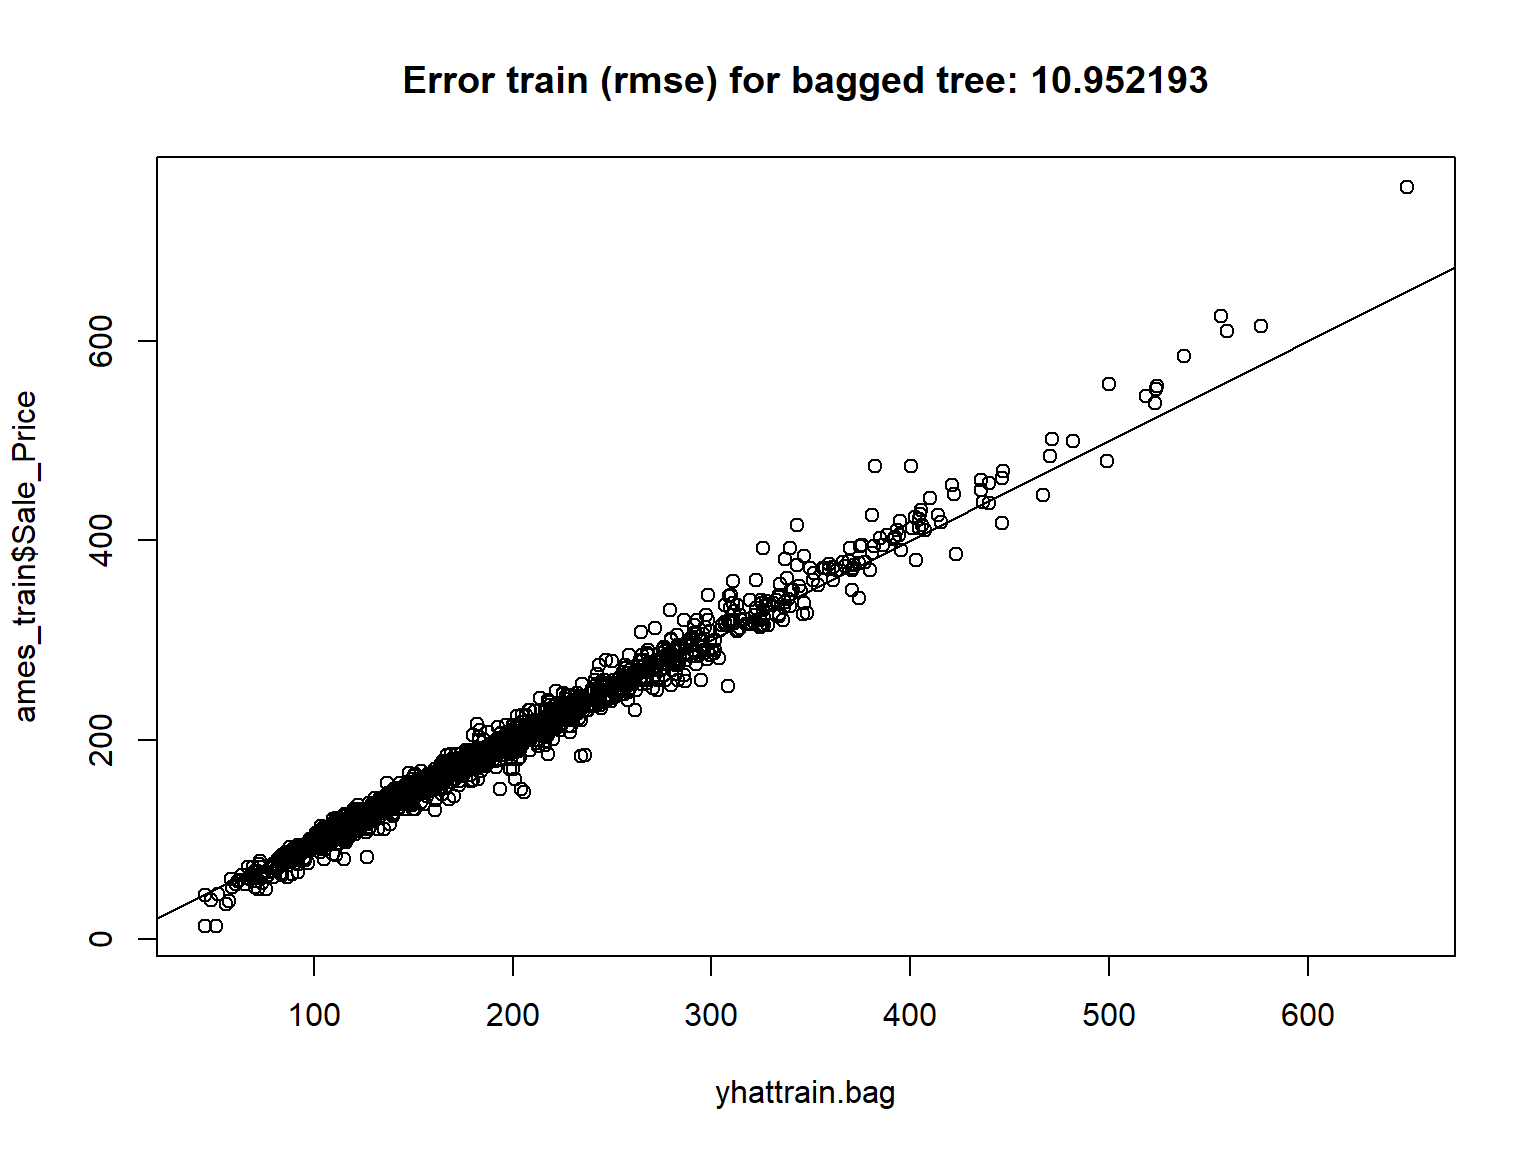
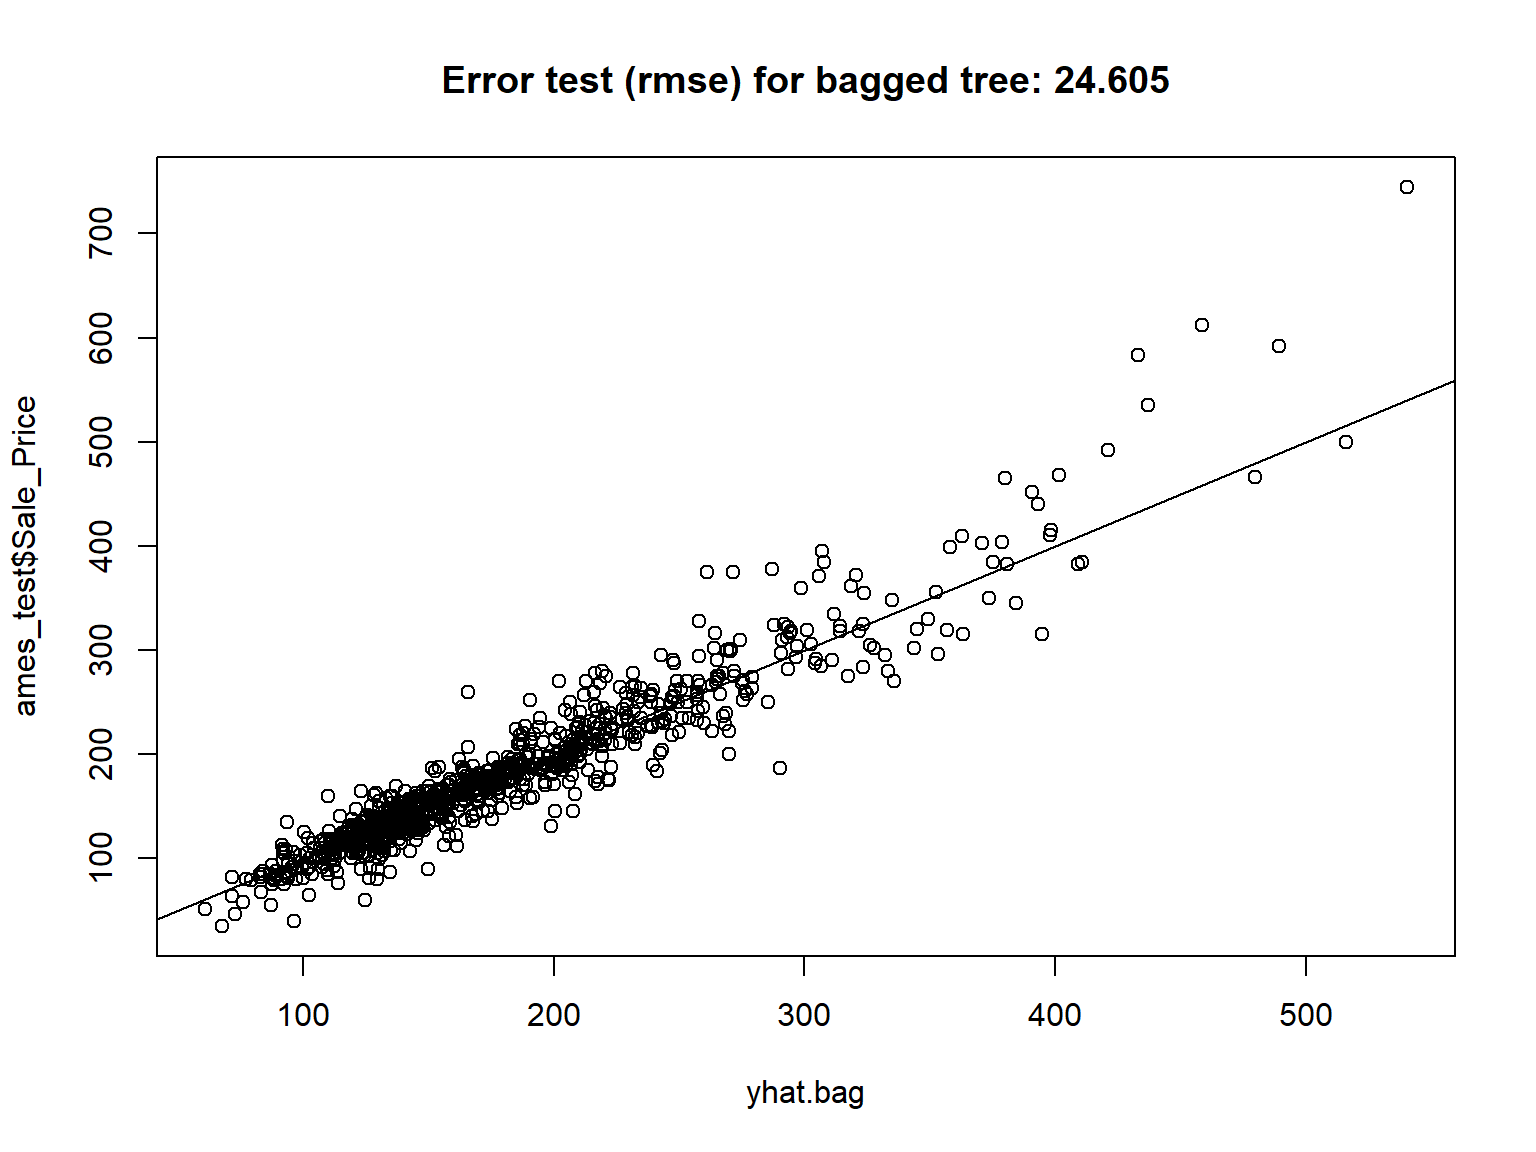
The following chunks of code show the fit between data and predictions for the train set, the test set and the out-of bag samples

Error estimated from train samples

Code
yhattrain.bag <- predict(bag.Ames, newdata = ames_train)
# train_mse_bag  <- sqrt(mean(yhattrain.bag - ames_train$Sale_Price)^2)
train_rmse_bag <- sqrt(mean((yhattrain.bag - ames_train$Sale_Price)^2))
showError<- paste("Error train (rmse) for bagged tree:", round(train_rmse_bag,6))
plot(yhattrain.bag, ames_train$Sale_Price, main=showError)
abline(0, 1)

THis error is much smaller even than those from trees because of overfitting

Error estimated from test samples

Code
yhat.bag <- predict(bag.Ames, newdata = ames_test)
# test_mse_bag  <- sqrt(mean(yhat.bag - ames_test$Sale_Price)^2)
test_rmse_bag  <- sqrt(mean((yhat.bag - ames_test$Sale_Price)^2))
showError<- paste("Error test (rmse) for bagged tree:", round(test_rmse_bag,4))
plot(yhat.bag, ames_test$Sale_Price, main=showError)
abline(0, 1)

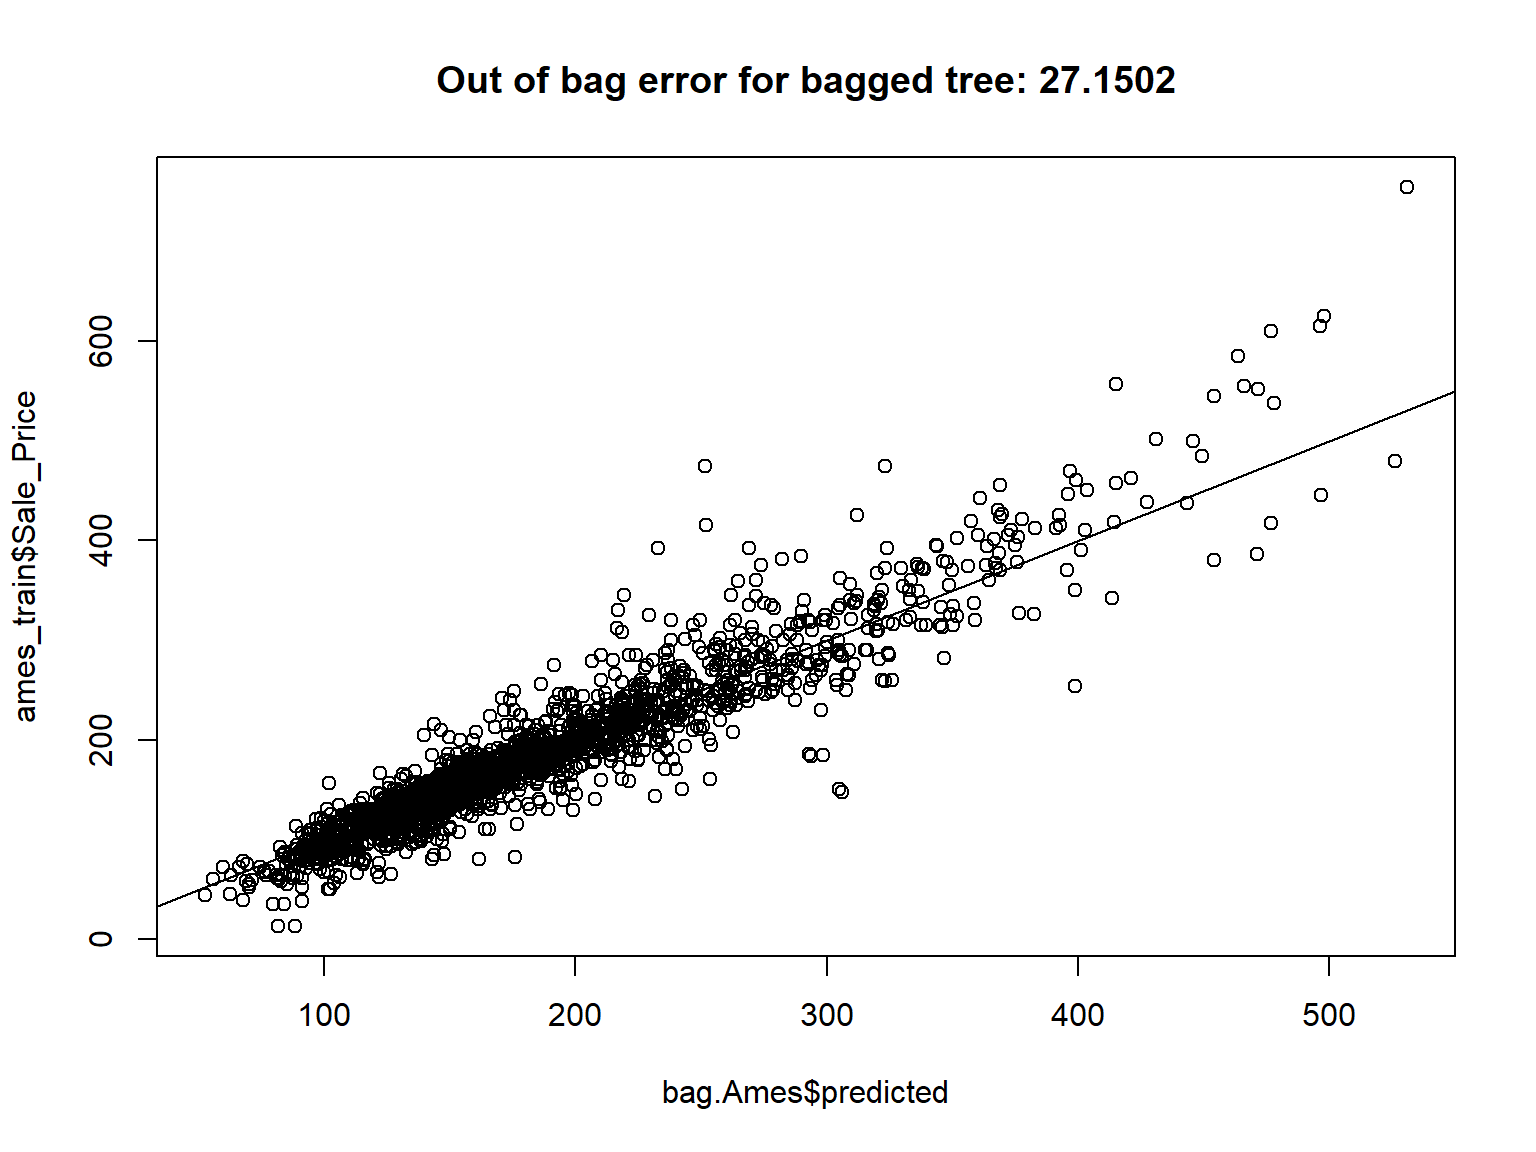
Error estimated from out-of-bag samples

Bagging allows computing an out-of bag error estimate.

Out of bag error rate is reported in the output and can be computed from the predicted (“the predicted values of the input data based on out-of-bag samples”)

Code
oob_err<- sqrt(mean((bag.Ames$predicted-ames_train$Sale_Price)^2))
showError <- paste("Out of bag error for bagged tree:", round(oob_err,4))
plot(bag.Ames$predicted, ames_train$Sale_Price, main=showError)
abline(0, 1)

Interestingly this may be not only bigger than the error estimated on the train set but also bigger than the error estimated on the test set.

We can collect error rates and compare to each other and also to those obtained from regression trees:

Code
errTable <- data.frame(Model=character(),  RMSE=double())
errTable[1, ] <-  c("Default Regression Tree", round(test_rmse1,2))
errTable[2, ] <-  c("Big Regression Tree", round(test_rmse2,2))
errTable[3, ] <-  c("Optimally pruned Regression Tree", round(test_rmse3,2))
errTable[4, ] <-  c("Bagged Tree with Train Data", round(train_rmse_bag,2))
errTable[5, ] <-  c("Bagged Tree with Test Data", round(test_rmse_bag,2))
errTable[6, ] <-  c("Bagged Tree with OOB error rate", round(oob_err,2))

Bagging parameter tuning

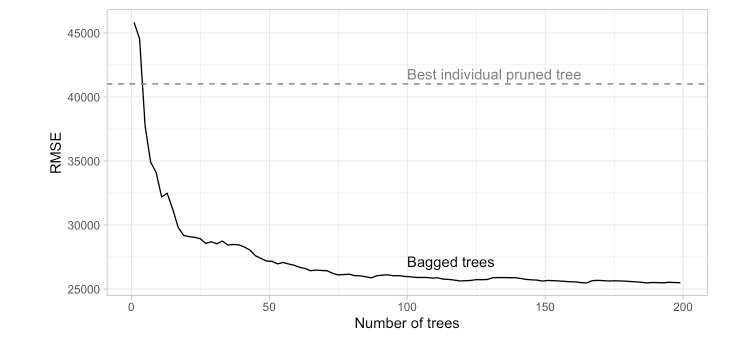
Bagging tends to improve quickly as the number of resampled trees increases, and then it reaches a platform.

The figure below has been produced iterated the computation above over nbagg values of 1–200 and applied the bagging() function.

Error curve for bagging 1-200 deep, unpruned decision trees. The benefit of bagging is optimized at 187 trees although the majority of error reduction occurred within the first 100 trees

Variable importance

Due to the bagging process, models that are normally perceived as interpretable are no longer so.

However, we can still make inferences about how features are influencing our model using feature importance measures based on the sum of the reduction in the loss function (e.g., SSE) attributed to each variable at each split in a given tree.

Code
require(dplyr)
VIP <- importance(bag.Ames) 
VIP <- VIP[order(VIP[,1], decreasing = TRUE),]
head(VIP, n=30)
                 %IncMSE IncNodePurity
Gr_Liv_Area    26.419428    1923769.45
Neighborhood   19.795920    5243520.37
Total_Bsmt_SF  14.370182    1012412.95
First_Flr_SF   13.467640     511525.12
MS_SubClass    10.468429     146349.46
BsmtFin_Type_1  9.491046      57870.21
Year_Remod_Add  9.273779     214595.97
Garage_Area     7.485364     334439.51
Year_Built      7.112852     266905.91
Fireplaces      6.999228      57043.18
Garage_Cars     6.915052    1777310.87
Bsmt_Unf_SF     6.879415      78882.32
Second_Flr_SF   6.867619     103373.55
Exterior_1st    6.699528      95407.73
Overall_Cond    6.676218      96814.53
Garage_Cond     6.622676      49944.12
Exterior_2nd    5.907220      61992.47
Latitude        5.872897      72448.76
Lot_Area        5.696540     134015.35
Longitude       5.055073      71328.45
Garage_Type     4.686528      37116.56
BsmtFin_SF_1    4.543646      10169.18
Bsmt_Exposure   4.500273      48517.30
Full_Bath       4.416821      84402.03
Garage_Finish   4.405324      24862.60
Sale_Condition  4.173237      25932.41
TotRms_AbvGrd   4.162582      27350.80
Central_Air     4.080131      21049.07
Heating_QC      3.922138      19705.37
Mas_Vnr_Area    3.862446      72973.11

Importance values can be plotted directly:

Code
invVIP <-VIP[order(VIP[,1], decreasing = FALSE),1] 
tVIP<- tail(invVIP, n=15)
barplot(tVIP, horiz = TRUE, cex.names=0.5)

Alternatively one can use the vipfunction from the vip package

Code
library(vip)
vip(bag.Ames, num_features = 40, bar = FALSE)

A random forest to improve bagging

Bagging can be improved if, instead of using all variables to build each tree we rely on subsets of variables, which are chosen at each split in order to decrease correlation between trees.

Random Forests are considered to produce good predictors with default values sop no parameter is set in a first iteration.

Code
# make bootstrapping reproducible
set.seed(123)

require(randomForest)
RF.Ames <- randomForest(Sale_Price ~ ., 
                         data = ames_train, 
                         importance = TRUE)
Code
show(RF.Ames)

Call:
 randomForest(formula = Sale_Price ~ ., data = ames_train, importance = TRUE) 
               Type of random forest: regression
                     Number of trees: 500
No. of variables tried at each split: 24

          Mean of squared residuals: 729.7088
                    % Var explained: 88.69
Code
yhat.rf <- predict(RF.Ames, newdata = ames_test)
plot(yhat.rf, ames_test$Sale_Price)
abline(0, 1)

Code
test_rmse_rf  <- sqrt(mean((yhat.rf - ames_test$Sale_Price)^2))
paste("Error test (rmse) for Random Forest:", round(test_rmse_rf,2))
[1] "Error test (rmse) for Random Forest: 24.57"
Code
errTable[7, ] <-  c("Random Forest (defaults)", round(test_rmse_rf,2))

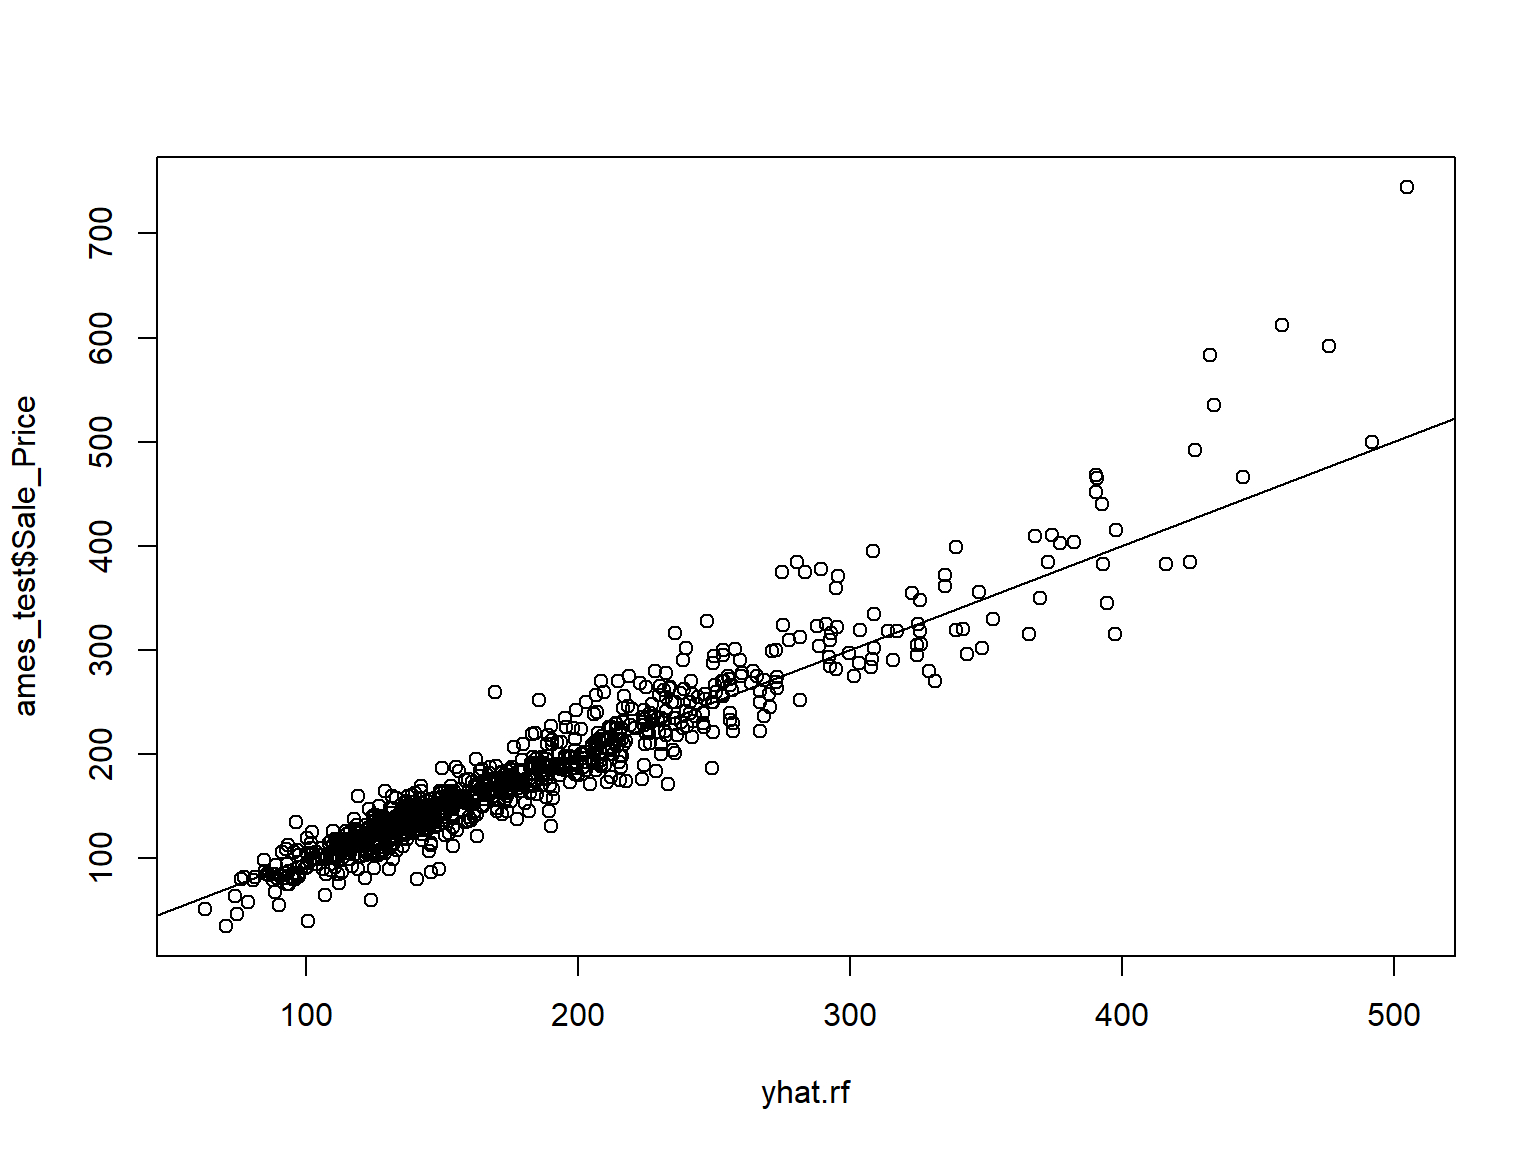
There is some improvement on bagging but it is clearly small.

Notice however that the percentage of explained variance is bigger for RF than for Bag

Parameter optimization for RF

Several parameters can be changed to optimize a random forest predictor, but, usually, the most important one is the number of variables to be randomly selected at each split \(m_{try}\), followed by the number of tree, which tends to stabilize after a certain value.

A common strategy to find the optimum combination of parameters is to perform a grid search through a combination of parameter values. Obviously it can be time consuming so a small grid is run in the example below to illustrate how to do it.

Code
num_trees_range <- seq(100, 400, 100)

num_vars_range <- floor(ncol(ames_train)/(seq(2,4,1)))

RFerrTable <- data.frame(Model=character(), 
                       NumTree=integer(), NumVar=integer(), 
                       RMSE=double())
errValue <- 1
system.time(
for (i in seq_along(num_trees_range)){
  for (j in seq_along(num_vars_range)) {  
    numTrees <- num_trees_range[i]
    numVars <- num_vars_range [j] # floor(ncol(ames_train)/3) # default
    RF.Ames.n <- randomForest(Sale_Price ~ ., 
                         data = ames_train, 
                         mtry = numVars,
                         ntree= numTrees,
                         importance = TRUE)
    yhat.rf <- predict(RF.Ames.n, newdata = ames_test)
    oob.rf <- RF.Ames.n$predicted
    
    test_rmse_rf  <- sqrt(mean((yhat.rf - ames_test$Sale_Price)^2))

  
    RFerrTable[errValue, ] <-  c("Random Forest", 
                            NumTree = numTrees, NumVar = numVars, 
                            RMSE = round(test_rmse_rf,2)) 
    errValue <- errValue+1
  }
}
)
   user  system elapsed 
 207.77    0.58  210.37 
Code
RFerrTable %>% knitr::kable()
Model NumTree NumVar RMSE
Random Forest 100 37 24.51
Random Forest 100 24 24.85
Random Forest 100 18 24.79
Random Forest 200 37 24.66
Random Forest 200 24 24.86
Random Forest 200 18 24.74
Random Forest 300 37 24.51
Random Forest 300 24 24.53
Random Forest 300 18 25.12
Random Forest 400 37 24.58
Random Forest 400 24 24.62
Random Forest 400 18 24.84

The minimum RMSE is attained at.

Code
bestRF <- which(RFerrTable$RMSE==min(RFerrTable$RMSE))
RFerrTable[bestRF,]
          Model NumTree NumVar  RMSE
1 Random Forest     100     37 24.51
7 Random Forest     300     37 24.51
Code
minRFErr <- as.numeric(RFerrTable[bestRF,4])
errTable[8, ] <-  c("Random Forest (Optimized)", round(minRFErr,2))

Error comparison for all approaches

Code
# kableExtra::kable(errTable) %>% kableExtra::kable_styling()
knitr::kable(errTable) 
Model RMSE
Default Regression Tree 39.69
Big Regression Tree 37.59
Optimally pruned Regression Tree 39.69
Bagged Tree with Train Data 10.95
Bagged Tree with Test Data 24.6
Bagged Tree with OOB error rate 27.15
Random Forest (defaults) 24.57
Random Forest (Optimized) 24.51

In summary, it has been shown that a Random Forest with 400 trees and 37 variables provides the smallest error rate, though the improvement on the default values and even the bagging approach is very small. This may be seen as a confirmation from the fact that Random Forests are well known to be good “out-of-the-box predictors”, that is that they perform well, even without tuning.

Variable importance

As could be expected, a variable importance plot shows that there is hardly any difference between the variables by bagging or random forests.

Code
library(vip)
vip(RF.Ames, num_features = 40, bar = FALSE)

Random Forests with Python

The following link points to a good brief tutorial on how to train and evaluate Random Forests using Python

DataCamp: Random Forest Classification with Scikit-Learn

References

Boehmke, Bradley, and Brandon Greenwell. 2020. The r Series Hands-on Machine Learning with r. CRC Press. https://www.routledge.com/Hands-On-Machine-Learning-with-R/Boehmke-Greenwell/p/book/9781138495685.