| raw | Bonferroni | FDR | |
|---|---|---|---|
| Quinolinate | 0.000003 | 0.000218 | 0.000218 |
| Glucose | 0.000016 | 0.001036 | 0.000276 |
| 3-Hydroxyisovalerate | 0.000019 | 0.001187 | 0.000276 |
| Leucine | 0.000020 | 0.001232 | 0.000276 |
| Succinate | 0.000029 | 0.001802 | 0.000276 |
| Valine | 0.000031 | 0.001922 | 0.000276 |
| N,N-Dimethylglycine | 0.000034 | 0.002125 | 0.000276 |
| Adipate | 0.000035 | 0.002206 | 0.000276 |
| myo-Inositol | 0.000040 | 0.002508 | 0.000279 |
| Acetate | 0.000069 | 0.004376 | 0.000415 |
| Glutamine | 0.000073 | 0.004616 | 0.000415 |
| Creatine | 0.000079 | 0.004978 | 0.000415 |
| Alanine | 0.000104 | 0.006570 | 0.000505 |
| Betaine | 0.000115 | 0.007265 | 0.000519 |
| Methylamine | 0.000127 | 0.008002 | 0.000533 |
| Pyroglutamate | 0.000172 | 0.010811 | 0.000616 |
| 3-Hydroxybutyrate | 0.000175 | 0.010994 | 0.000616 |
| cis-Aconitate | 0.000183 | 0.011547 | 0.000616 |
| Formate | 0.000186 | 0.011730 | 0.000616 |
| Tryptophan | 0.000196 | 0.012323 | 0.000616 |
| Dimethylamine | 0.000282 | 0.017772 | 0.000846 |
| Creatinine | 0.000327 | 0.020605 | 0.000937 |
| Tyrosine | 0.000525 | 0.033090 | 0.001439 |
| Sucrose | 0.000710 | 0.044700 | 0.001862 |
| 3-Indoxylsulfate | 0.000924 | 0.058182 | 0.002327 |
| Lactate | 0.000978 | 0.061634 | 0.002371 |
| Threonine | 0.001134 | 0.071410 | 0.002645 |
| Asparagine | 0.001204 | 0.075839 | 0.002709 |
| Histidine | 0.001272 | 0.080105 | 0.002762 |
| trans-Aconitate | 0.001349 | 0.084962 | 0.002832 |
| Xylose | 0.001445 | 0.091016 | 0.002915 |
| Serine | 0.001486 | 0.093637 | 0.002915 |
| Pyruvate | 0.001527 | 0.096207 | 0.002915 |
| 2-Hydroxyisobutyrate | 0.001952 | 0.122970 | 0.003581 |
| Lysine | 0.001989 | 0.125320 | 0.003581 |
| Fumarate | 0.002326 | 0.146544 | 0.004071 |
| 2-Aminobutyrate | 0.002924 | 0.184225 | 0.004979 |
| Fucose | 0.003358 | 0.211567 | 0.005568 |
| Citrate | 0.004126 | 0.259970 | 0.006666 |
| tau-Methylhistidine | 0.004324 | 0.272399 | 0.006810 |
| Trigonelline | 0.005797 | 0.365230 | 0.008816 |
| Hippurate | 0.005877 | 0.370276 | 0.008816 |
| Trimethylamine N-oxide | 0.006344 | 0.399666 | 0.009295 |
| O-Acetylcarnitine | 0.007151 | 0.450507 | 0.010239 |
| Ethanolamine | 0.008639 | 0.544251 | 0.012094 |
| Glycine | 0.014320 | 0.902160 | 0.019612 |
| Taurine | 0.019209 | 1.000000 | 0.025748 |
| 1,6-Anhydro-beta-D-glucose | 0.026248 | 1.000000 | 0.034230 |
| pi-Methylhistidine | 0.026623 | 1.000000 | 0.034230 |
| Guanidoacetate | 0.027876 | 1.000000 | 0.035124 |
| Glycolate | 0.028844 | 1.000000 | 0.035631 |
| 4-Hydroxyphenylacetate | 0.031695 | 1.000000 | 0.038400 |
| Carnitine | 0.035584 | 1.000000 | 0.042298 |
| 2-Oxoglutarate | 0.044770 | 1.000000 | 0.052232 |
| Isoleucine | 0.051845 | 1.000000 | 0.059386 |
| 1-Methylnicotinamide | 0.063494 | 1.000000 | 0.071431 |
| Hypoxanthine | 0.093111 | 1.000000 | 0.102912 |
| 3-Aminoisobutyrate | 0.181820 | 1.000000 | 0.197494 |
| Tartrate | 0.188030 | 1.000000 | 0.200778 |
| Pantothenate | 0.223280 | 1.000000 | 0.234444 |
| Methylguanidine | 0.241610 | 1.000000 | 0.249532 |
| Uracil | 0.295780 | 1.000000 | 0.300551 |
| Acetone | 0.425500 | 1.000000 | 0.425500 |
Pathway Analysis for metabolomics
Introduction and Objectives
Introducing myself
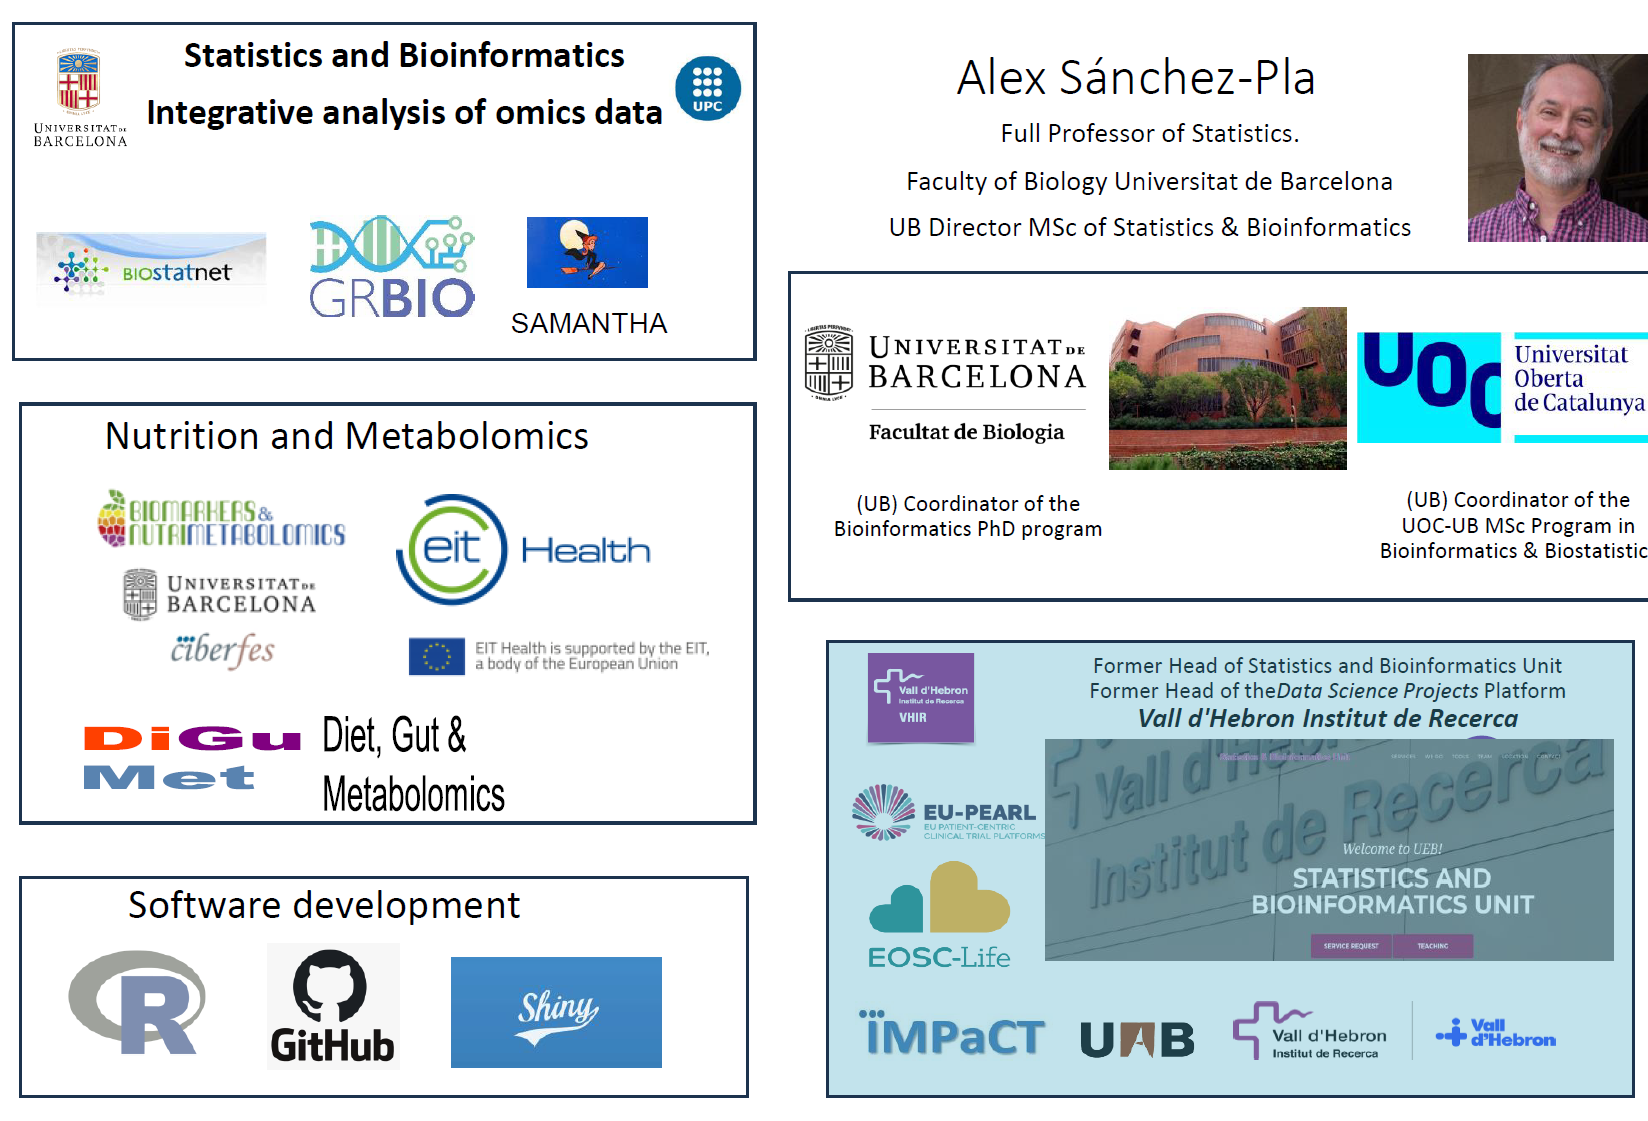
Introducing Our groups

Statistics & Bioinformatics and Nutrition & Metabolomics groups @ UB
Session objectives
Overview of Patwhay Analysis for Metabolomics
Introduce its components and
Go through some methods with some detail
Discuss some limitations and provide recomendations.
Introduce some tools for Pathway Analysis
Get a practical grasp of how to apply it.
Session Outline
Introduction and objectives
Metabolite lists: What do they mean
Information sources to support interpretation
Methods and Tools to extract information
The limitations of PwA. Some recommendations
Software tools for PwA
Practical session
Health, Disease and Pathways
Metabolism is a complex network of chemical reactions within the confines of a cell that can be analyzed in self-contained parts called pathways.
We often assume that “normal” metabolism is what happens in healthy state or, that disease can be associated with some type of alteration in metabolism.
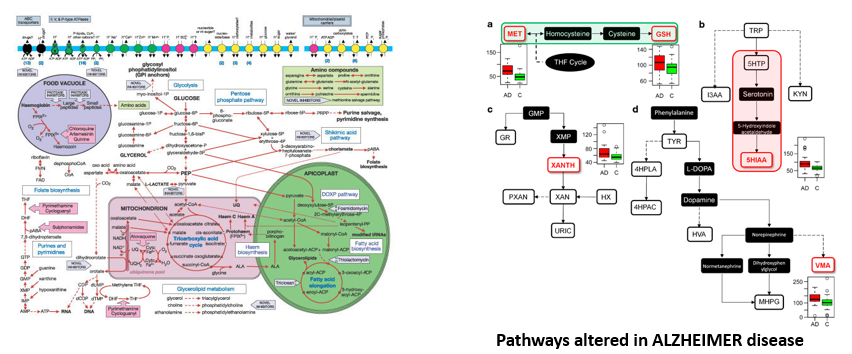
Characterization of disease attempted studying how ths disrupts pathways
So what is Pathway Analysis?
… any analytic technique that benefits from biological pathway or molecular network information to gain insight into a biological system. (Creixell et alt., Nature Methods 2015 (12 (7))
Pathway Analysis methods rely on high throughput information provided by omics technologies to:
- Contextualize findings to help understand biological processes
- Identify fetures associated with a disease
- Predict drug targets
- Understand how to intervene in disease
- Conduct target literature searches
- Integrate diverse biological information
From samples to features lists
Bioinformatics workflows
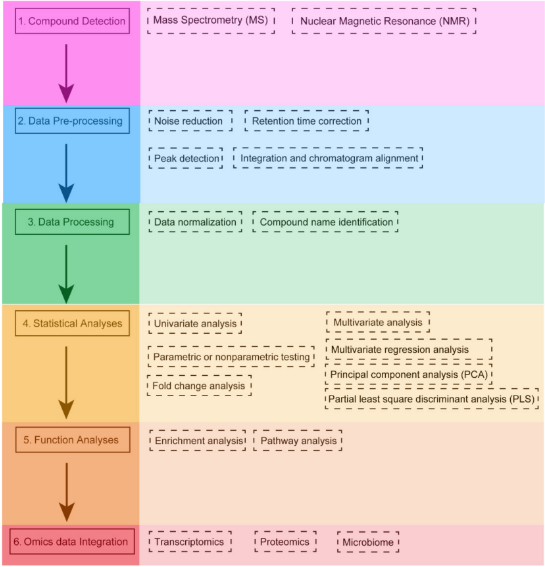
From samples to features lists (2)
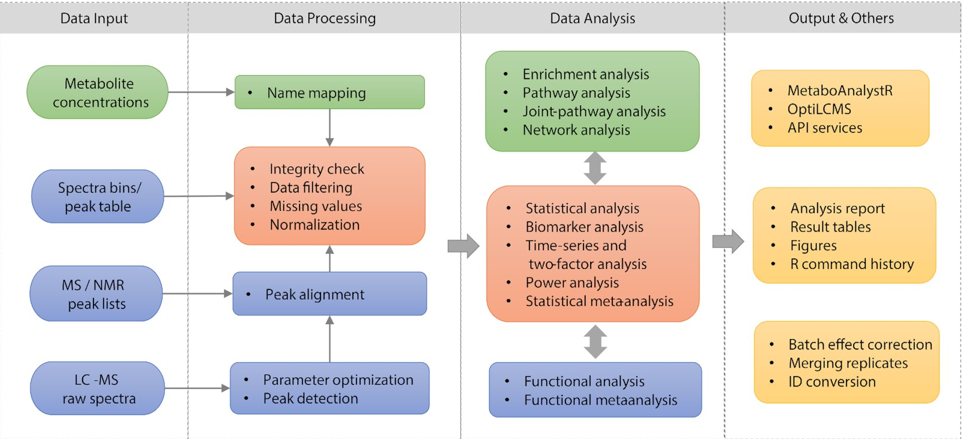
Metabolomics Workflows in MetaboAnalyst 5.0
Analysis yields metabolites lists
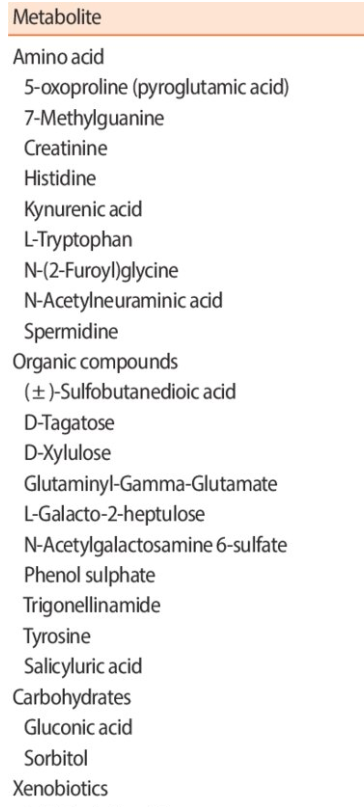
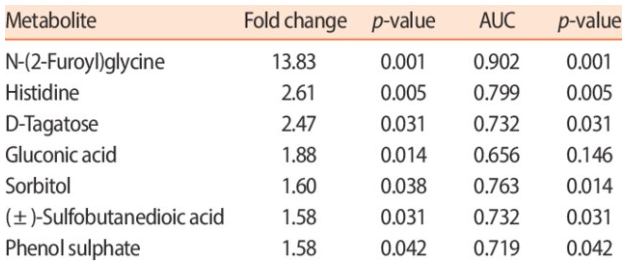
Metabolites lists are diverse:
- Truncated vs All the features analyzed
- Ordered vs unordered
- Only IDs vs IDs with difference measures
An open problem: Metabolites IDs
To be able to do Pathway Analysis, metabolites need to be mappable to their sources of information.
- Must be uniquely identifiable by names/IDs.
- Must be possible to link/relate these names/IDs with the corresponding IDs in the source of information we wish to rely.
This is far from possible for all metabolites.
Uniquely and unambiguosly naming all metabolites is, in the best of cases, “work in progress”.
Different annotation levels
- Exact structure, including stereochemistry and bond geometry
- Regiochemistry level (stereochemistry and bond geometry unknown)
- Molecular species level (regiochemistry unknown)
- Species level (no information on structural features)
Many names and descriptors
- Computed descriptors
- IUPAC name
- InChI, InChIKey
- SMILES (canonical or isomeric)
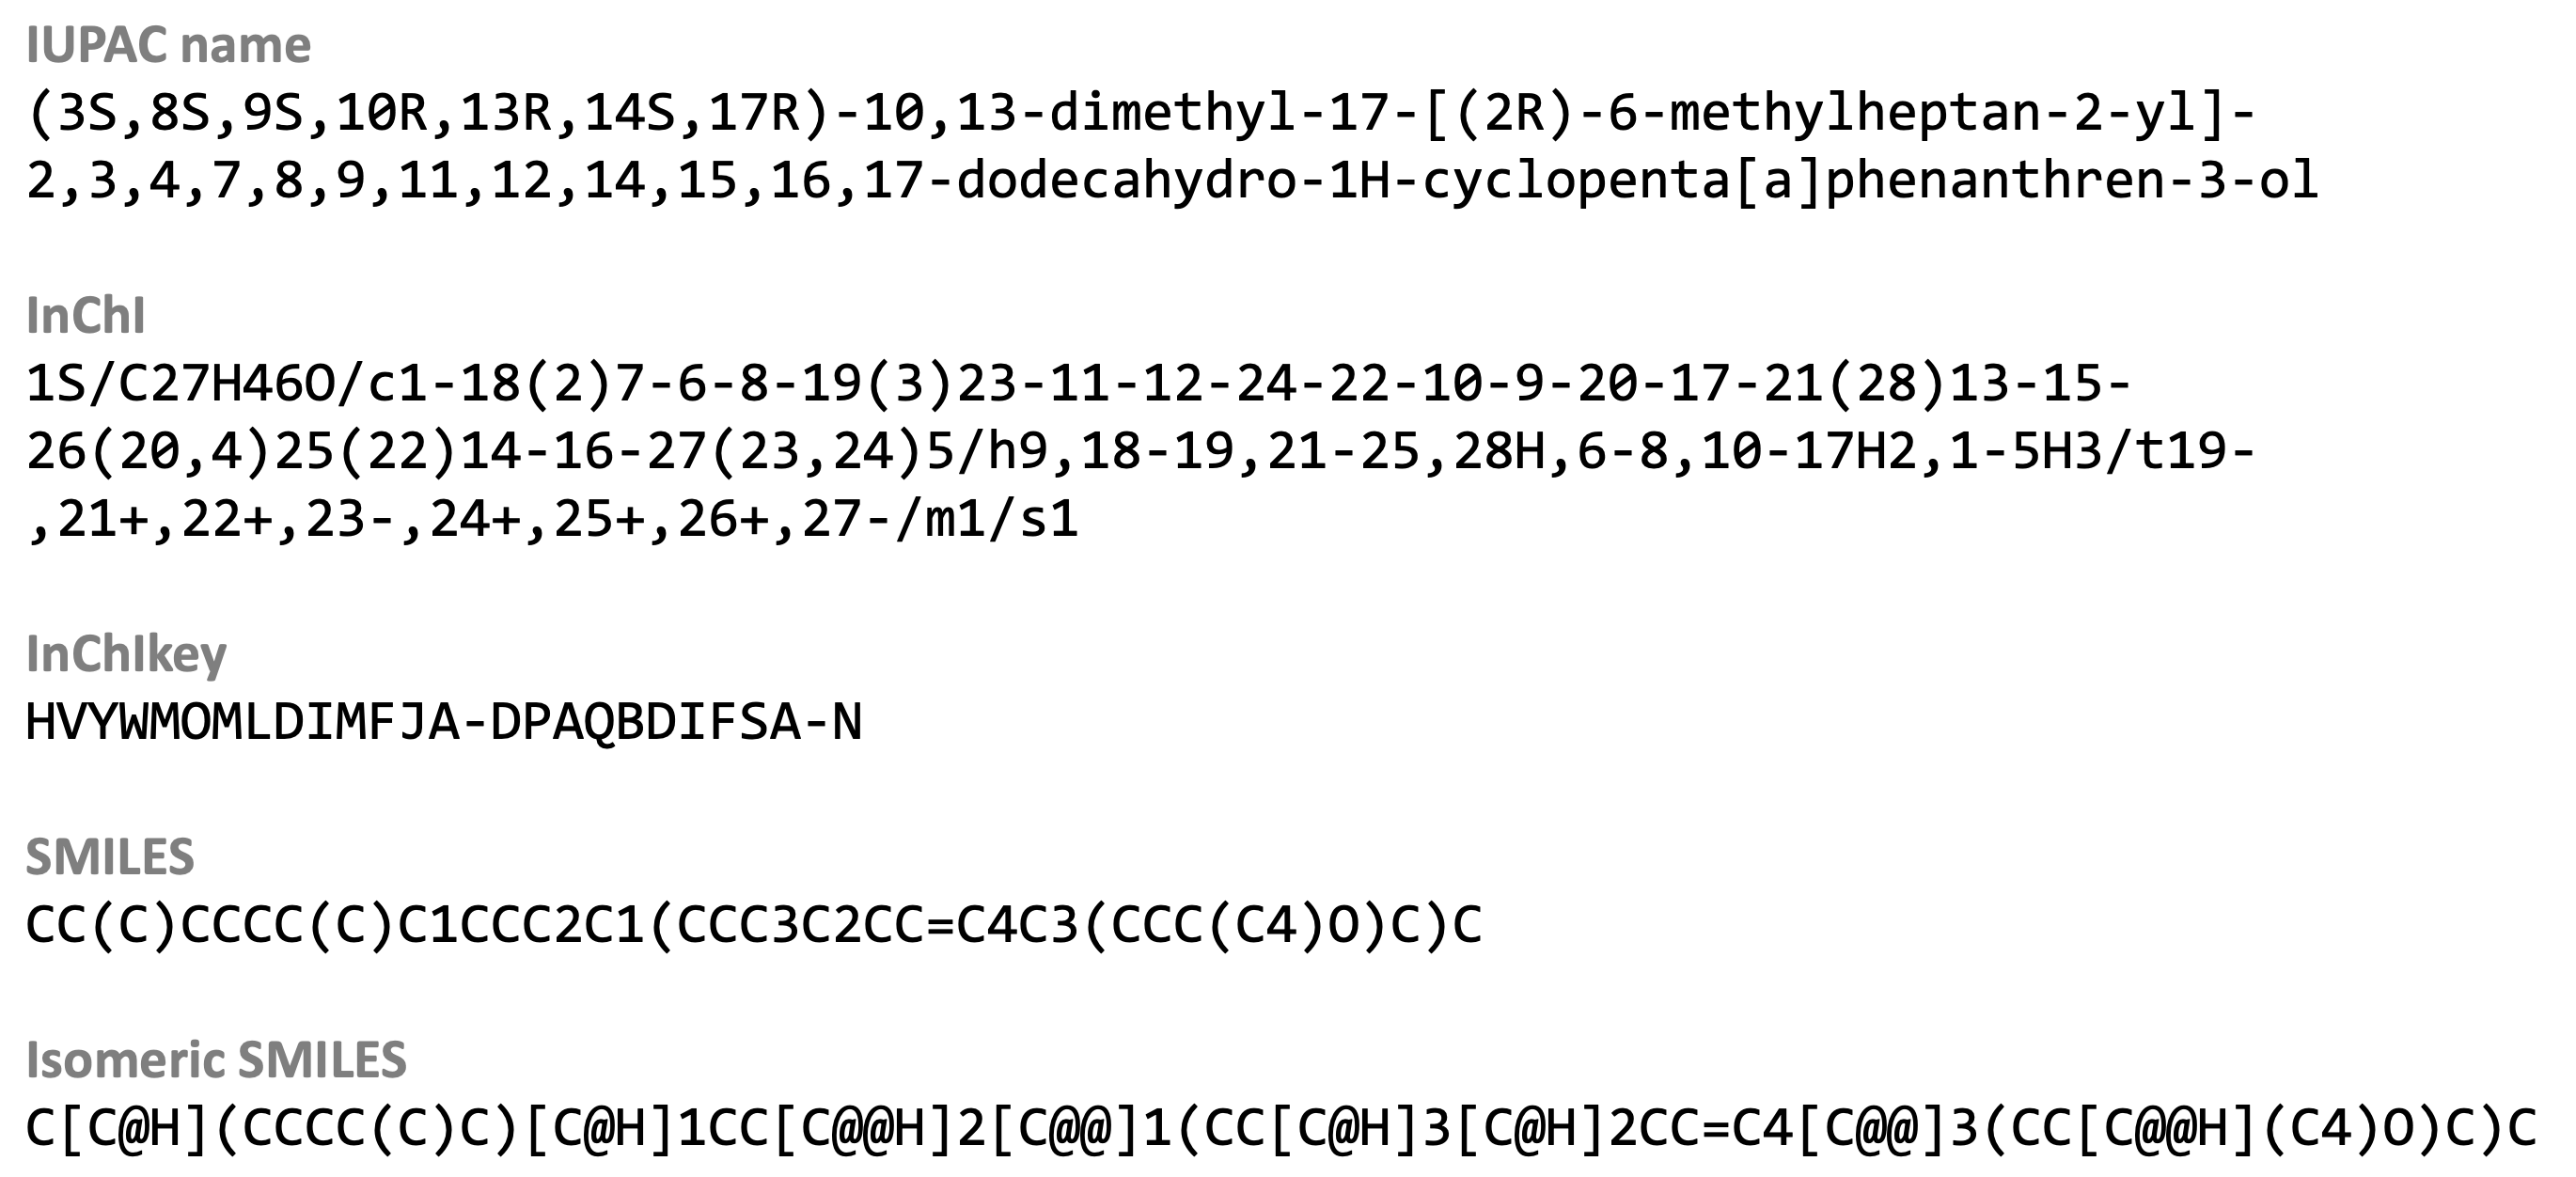
Computed descriptors for Cholesterol
Many names and descriptors
- Non-systematic identifiers
- Common name
- RefMet Name
- PubChem ID
- HMDB ID
- ChEBI ID
- KEGG ID
- LipidMaps ID
- Drug Bank ID
- Metabolomics Workbench ID
- CAS
- Deprecated CAS
- …
Many synonyms
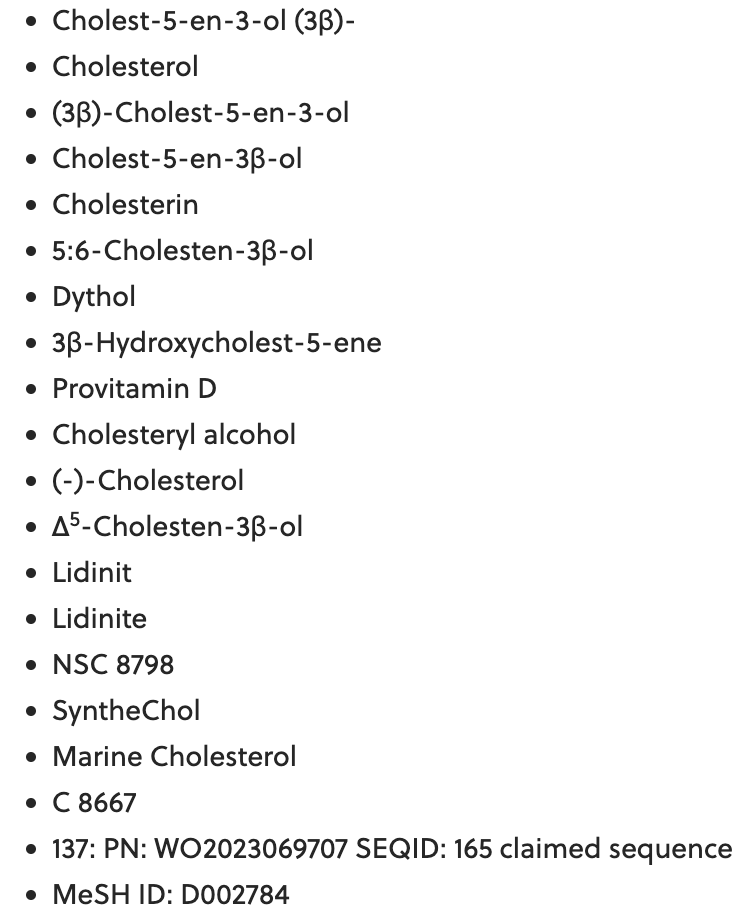
Other names for Cholesterol
Many solutions
Some compund databases
Many solutions
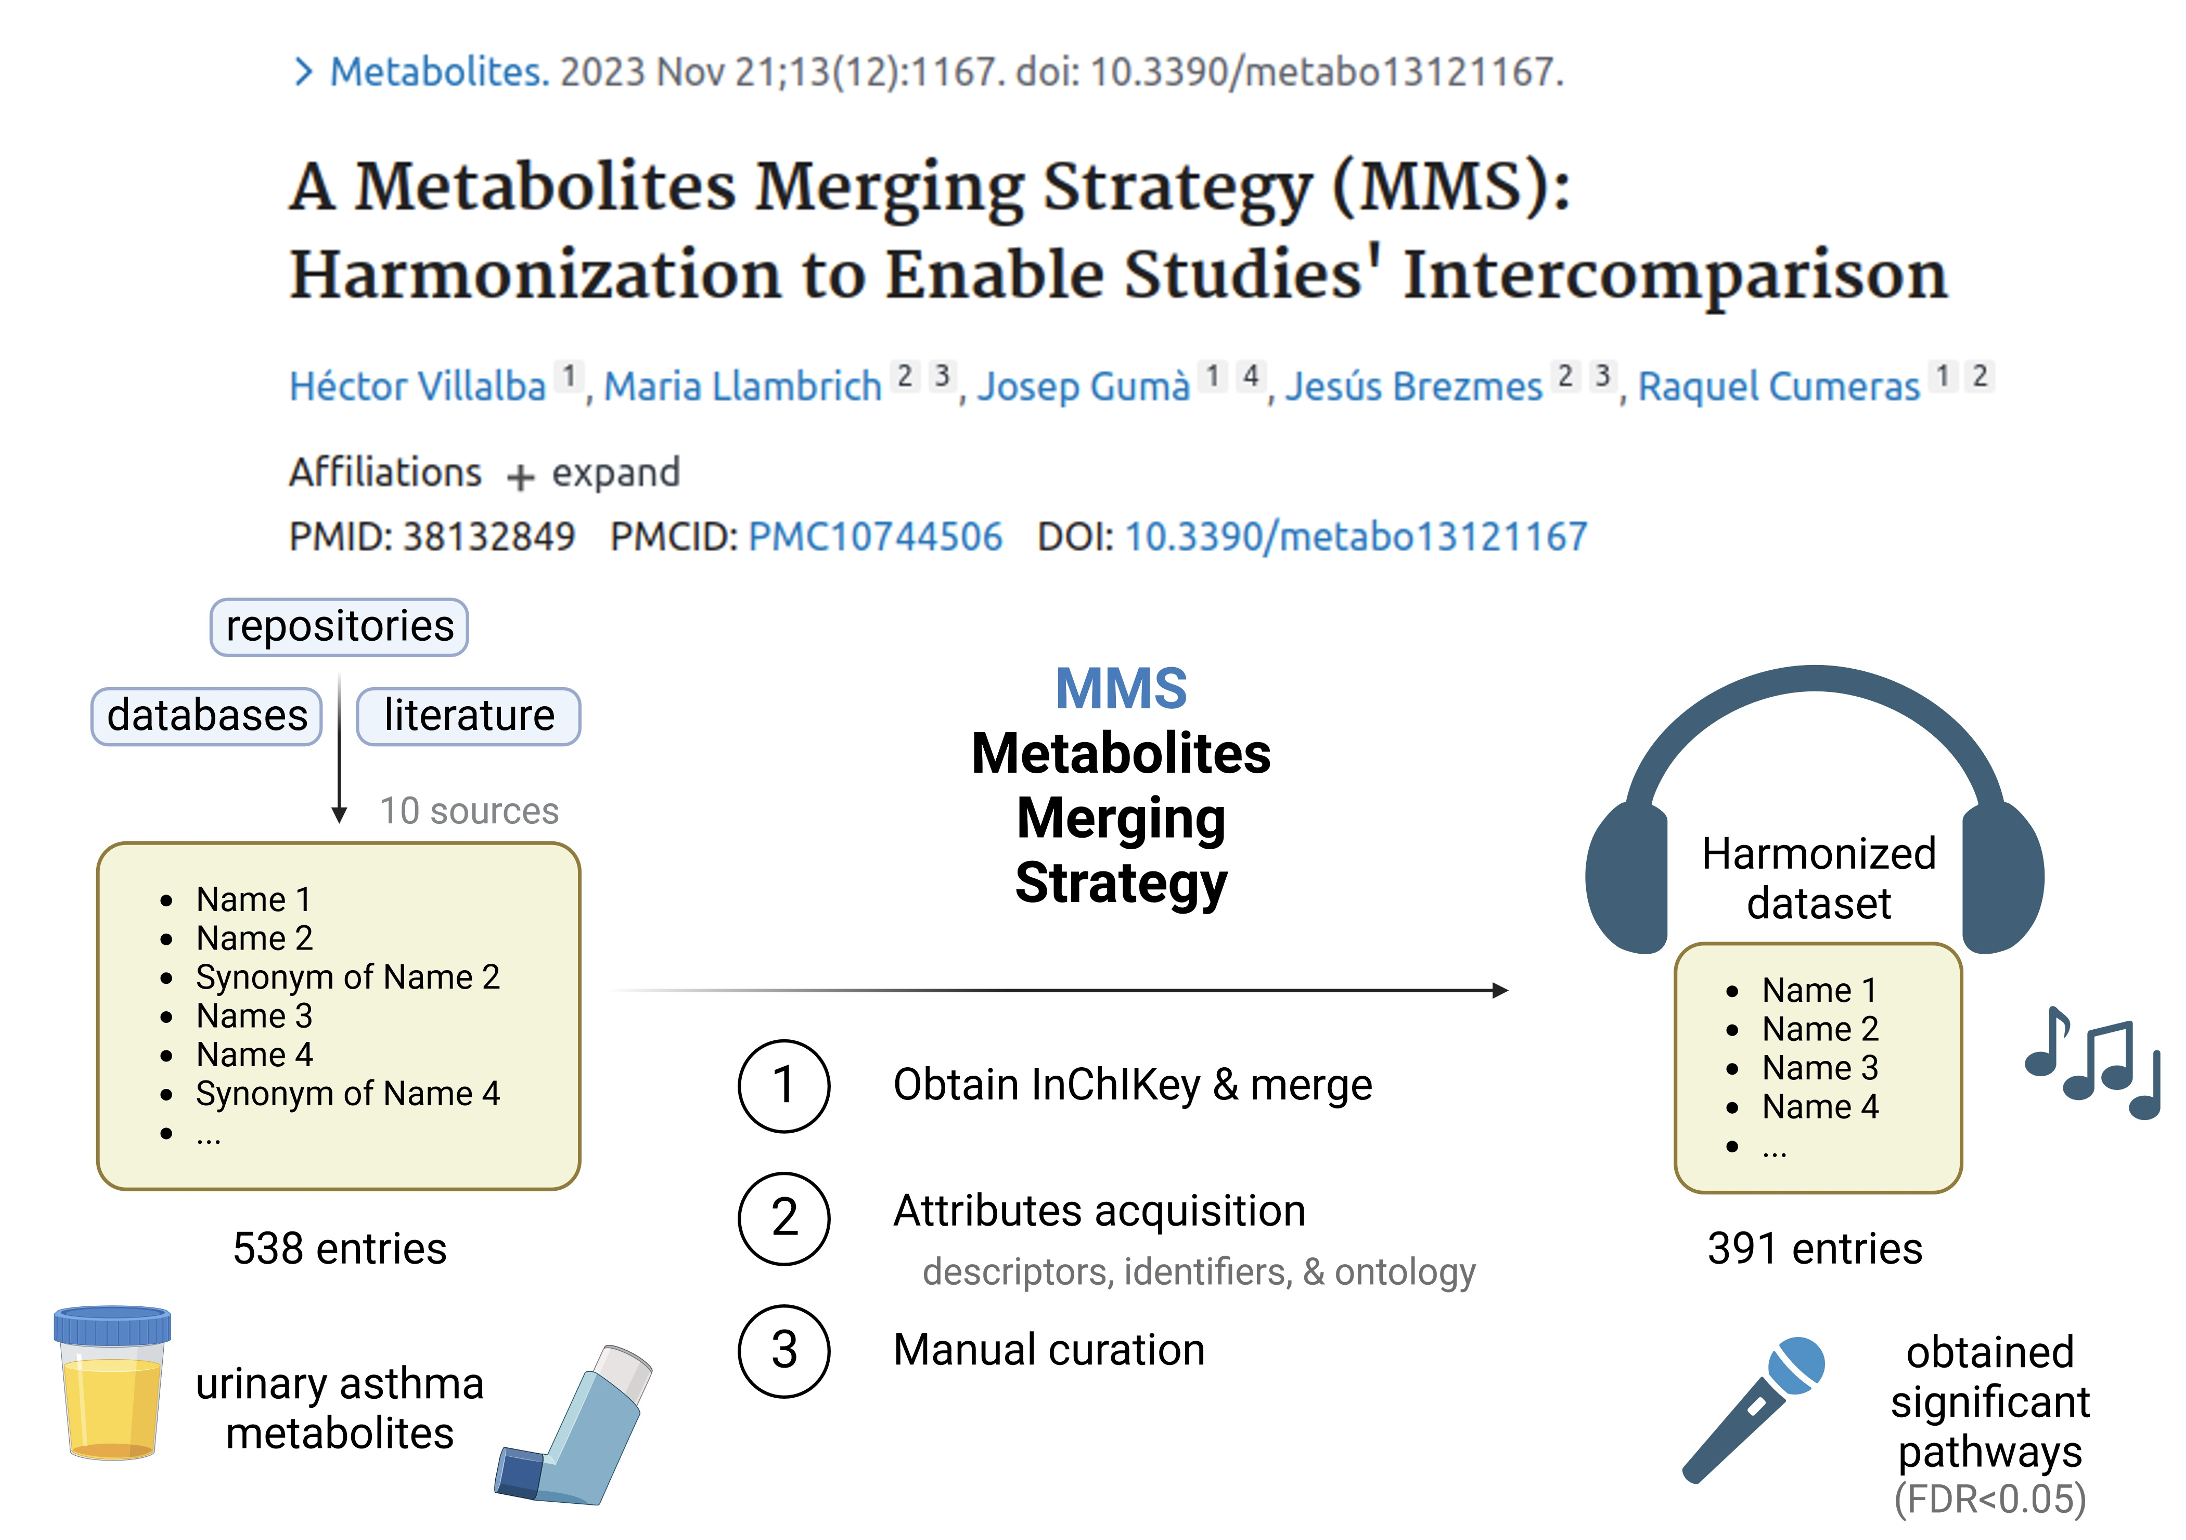
This study highlights the need for standardized and unified metabolite datasets to enhance the reproducibility and comparability of metabolomics studies.
The where to, now? question
Once a list of feature is obtained it can be studied on a one-by-one basis
Select some features for biochemical validation,
Map individual features to specific pathways,
Perform functional assays,
Do a literature search …
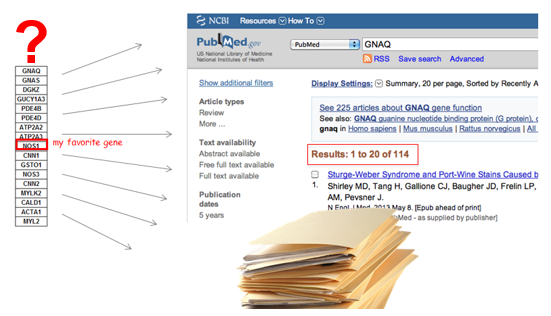
This will yield useful information, but
- It may be slow and resource-consuming
- It does not account for interaction between features.
And here comes Pathway Analysis
Pathway Analysis studies the list as a whole.
With this aim it combines:
- The list of features, with
- Pre-existing sources of information related to them
And, after some processing, it yields
- some type of scores about
- groups of features appearing to be significantly related with the process being studied.
How can we interpret these lists?
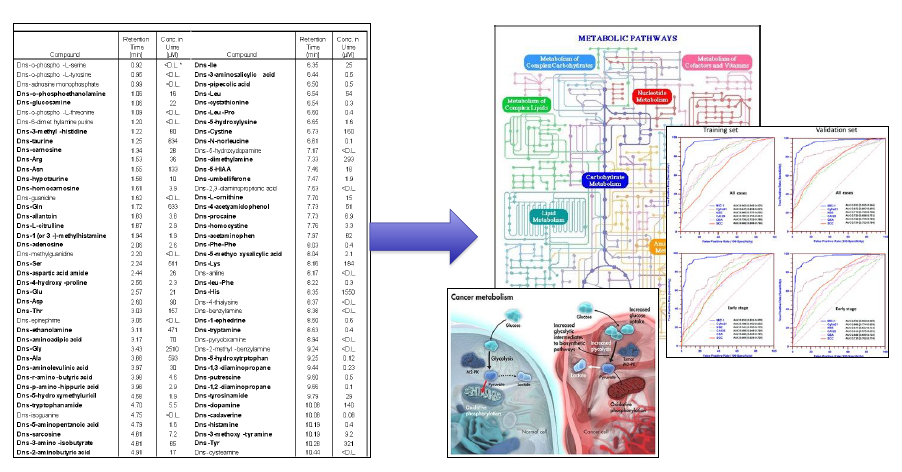
From Lists to Biology
Ontologies, Databases and Metabolite Sets
The elements of Pathways Analysis
Loosely speaking, to do Pathway Analysis one needs:
A list of features, characterizing a process.
A source of information about these features.
An algorithm to highlight relevant information by linking list and source.
A tool implementing the algorithm.
In this section, we focus on sources of information and on how to provide it to the algorithms.
Sources of information for PWA
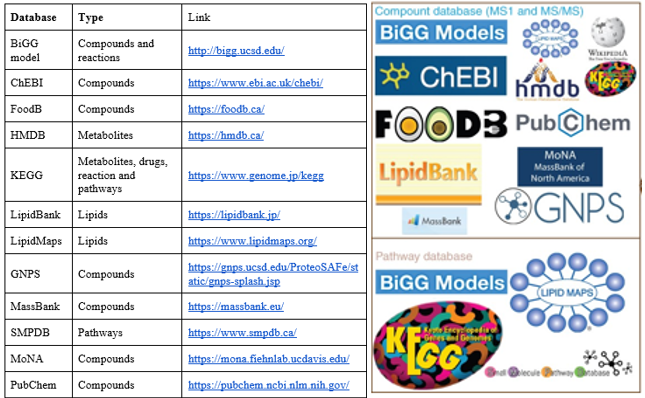
Some common databases in Metabolomics
Ontologies, Databases et alt.
Although incomplete s.o.i are multiple and diverse.
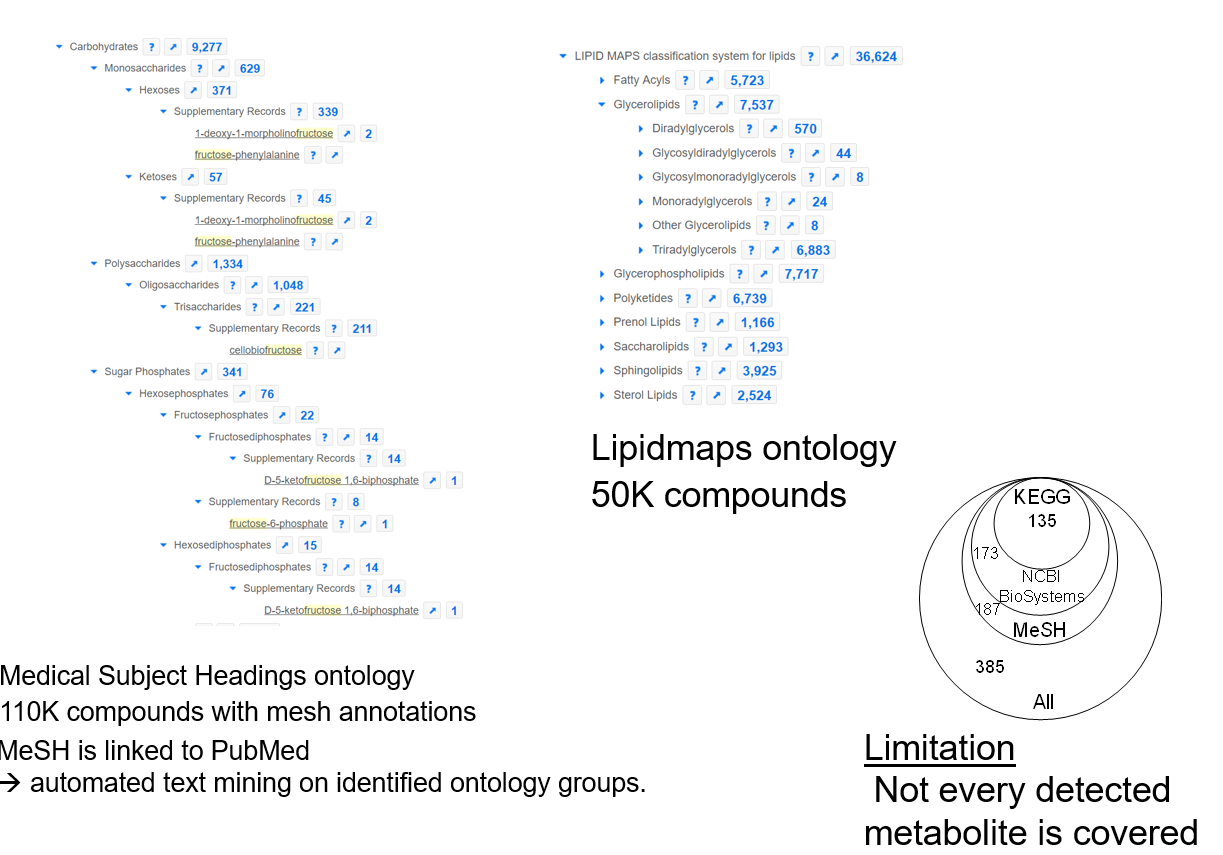
- Ontologies: Structured vocabularies for categorizing and describing relationships within a domain. GO, ChEBI
- Pathway Databases: Detailed information about biological pathways and their the biological context. KEGG, Reactome, SMPDB.
- Compound Databases: Information on small molecules for identification and characterization of metabolites. HMDB, PubChem, LipidMaps, and MassBank
- And many more: Networks DBs, Spectral DBs, …
The Human Metabolome DB
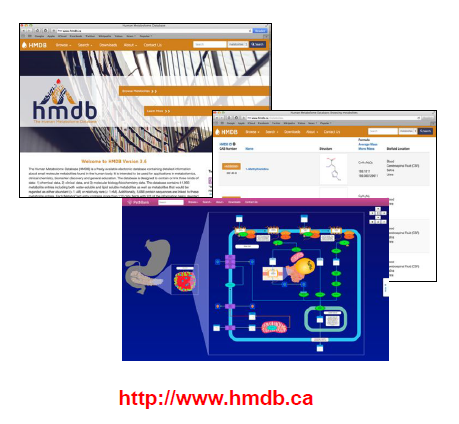
- Detailed information about human metabolites, their structures, pathways, origins, concentrations, functions and reference spectra
- HMDB has 248,855 metabolites, 132,335 pathways, 3.1 million MS and NMR spectra, metabolite biomarker data on >600 diseases
- A resource established to provide reference metabolite values for human disease, human exposures & population health
- Captures both targeted and untargeted metabolomics (and exposomics) data
The Food Constituent Database
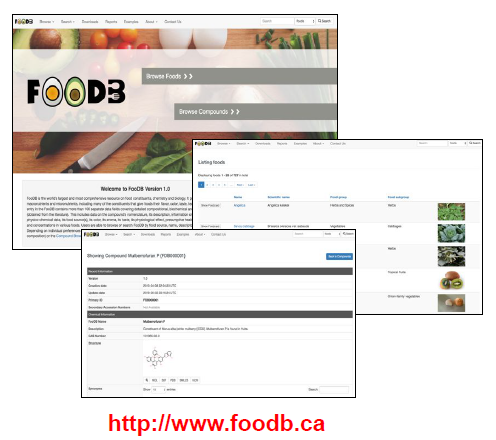
- Database of 70,000+ compounds found in 727 foods and their effects on flavour, aroma, colour and human health
- Comprehensive concentration information to ID foods that are rich in particular micronutrients
- Links chemistry to food types (biological species) to flavour, aroma, colour and human health
- Supports sequence, spectral, structure and text searches
The KEGG DB
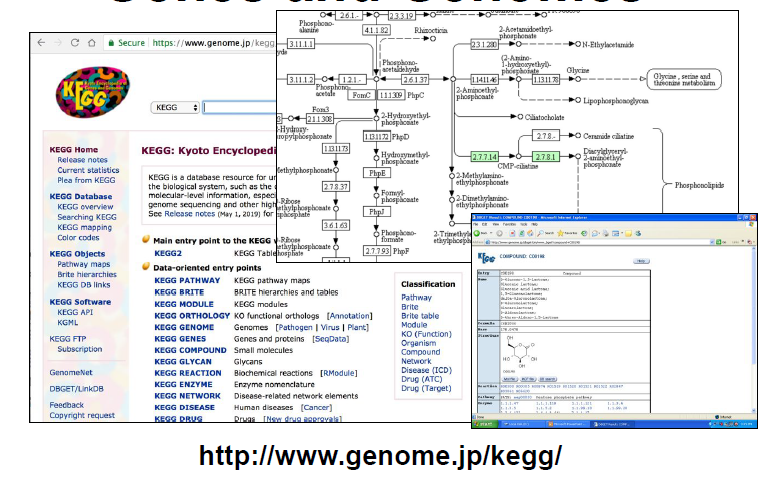
- The “Go-to” Metabolic Pathway Database
- Has 535 “canonical” pathway diagrams or maps covering 5994 organisms for a total of 604,808 pathways
- ~170 metabolic pathways covering 18,553 compounds, includes many disease pathways (80), protein signaling (70) pathways, and biological process pathways (70)
- Metabolic pathways are highly schematized and mostly limited to catabolic and anabolic processes
Small Molecule Pathway Database
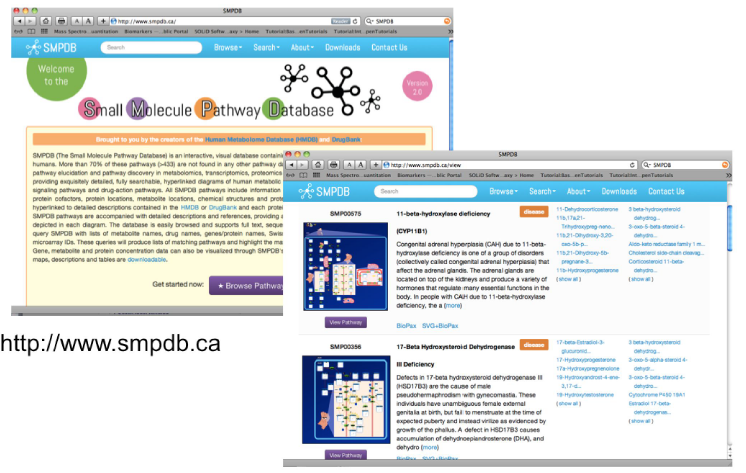
Nearly 48,900 hand-drawn small molecule pathways – 404 drug action pathways – 20,251 metabolic disease pathways – 27,876 metabolic pathways – 160+ signaling and other pathways
Depicts organs, cell compartments, organelles, protein locations, and protein quaternary structures
Maps gene chip & metabolomic data
Converts gene, protein or chemical lists to pathways or disease diagnoses
Obtaining Metabolite Sets
As described, PwA matches lists of metabolites with previously defined metabolite sets that characterize a process, a disease or a group.
Some sources of information (Ontologies, Pathways DBs) directly provide metabolite sets.
For compound DBs, Metabolite sets have to be built
- By manual curation
- Automatically (some type of clustering)
Metabolites Set libraries

Overview of MSEA’s metabolite set libraries
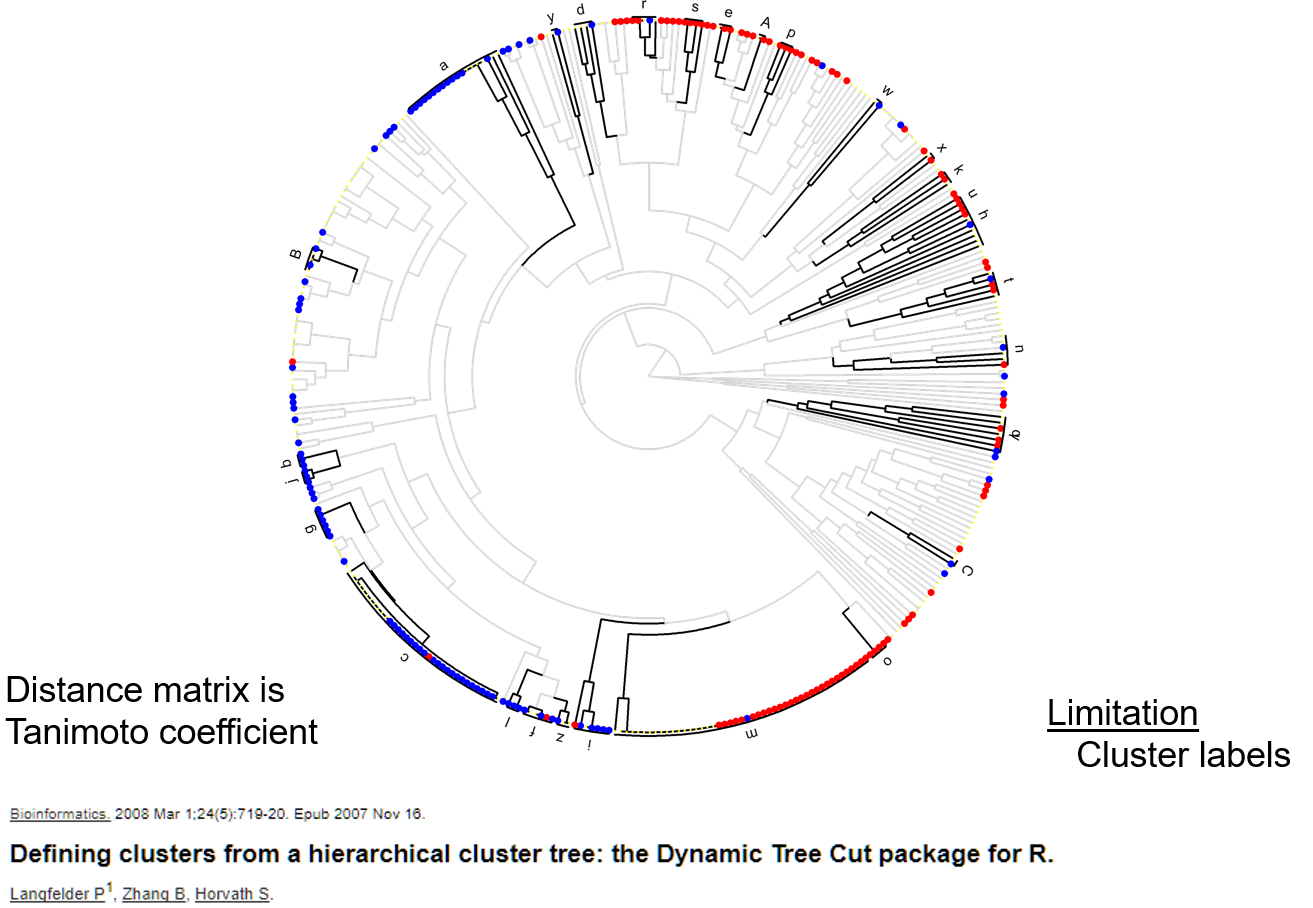
Metamap clusters
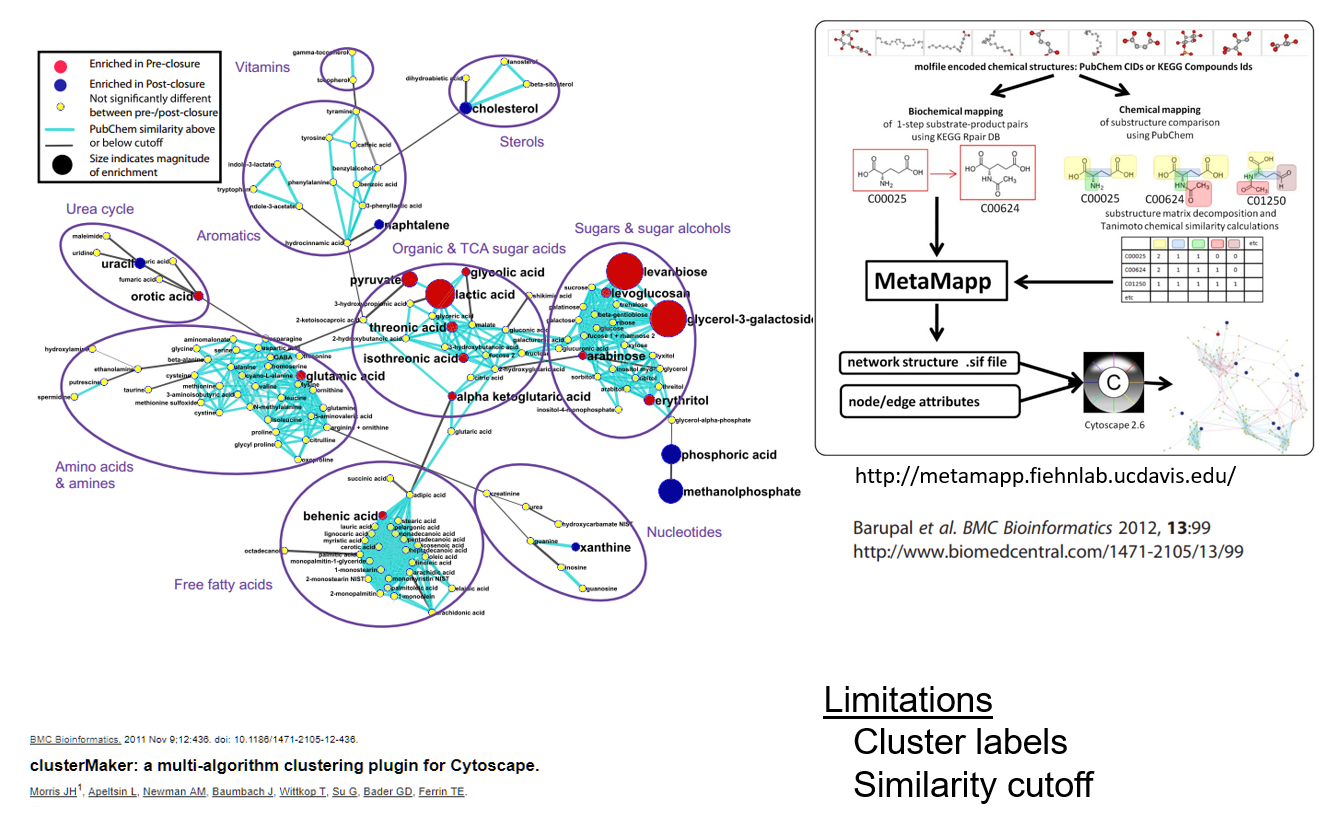
Chemical similarity clusters
Chemical Ontologies
Analysis Methods
Types of Pathway Analysis
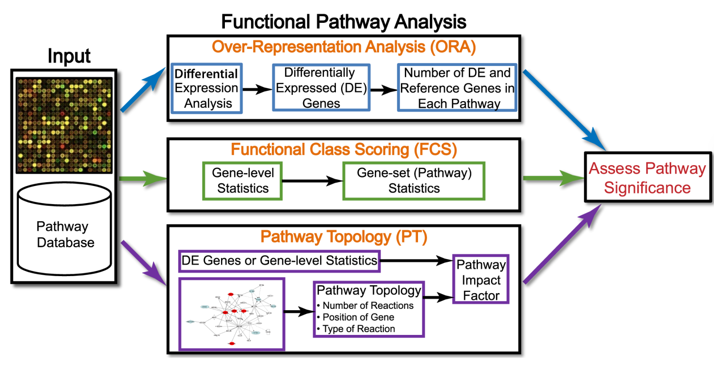
Over-representation Analysis
Given
- A feature (metabolites) list (from some study).
- A collection of feature (metabolites) sets (…)
The goal is finding out if any of the feature sets surprisingly enriched in the feature list?
- Need to define “surprisingly” (statistics)
- Need to deal with test multiplicity?
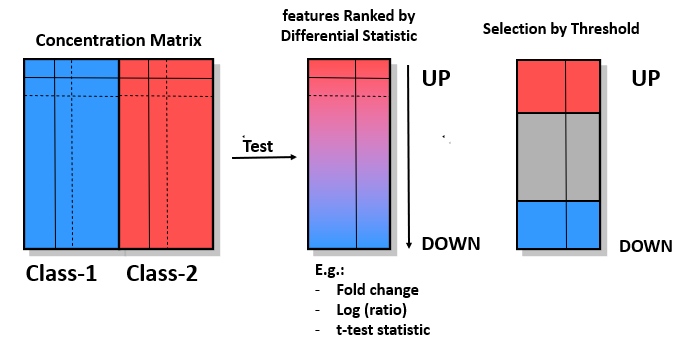
Obtaining feature lists
Assessing “surprisingly”
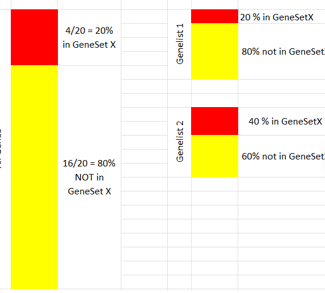
Given a feature list, “fl”, and a feature set, “FS”, check if the % of genes in “fl” annotated in “FS” the same as the % of genes globally annotated in “FS”?
- If both percentages are similar \(\rightarrow\) No Enrichment.
- If the % of features in “FS” is greater in “fl” than in the rest of genes \(\rightarrow\) “fl” is enriched in “GS”
Example
Assess significance: Fisher test
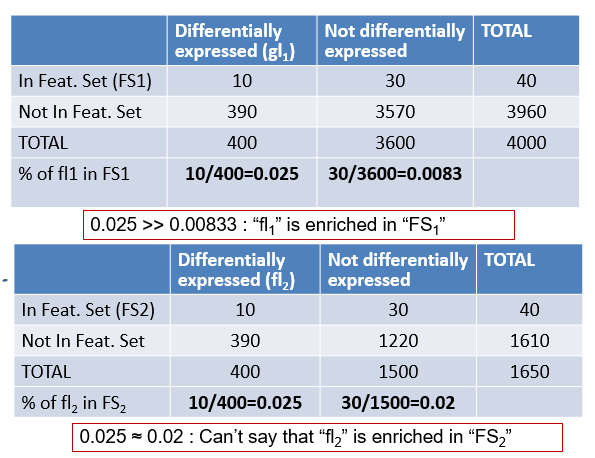
- The example shows two cases
- One where percentages are quite different
- Another where percentages are similar.
- How can we set a threshold to decide that the difference is “big enough” to call it “Enriched”
- Use Fisher Test or, equivalently,
- a test to compare proportions or
- a hypergeometric test.
Example 1: Surprisingly enriched
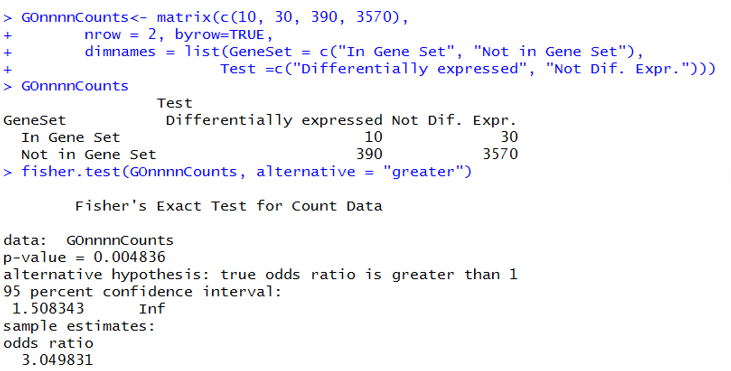
P-value small, odds-ratio high: List is surprisingly enriched in Feature Set
Example 2: Non-enriched
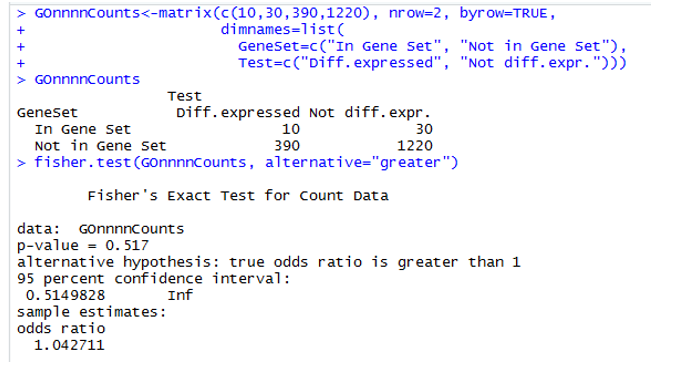
P-value high, odds-ratio around 1: List is not enriched in Feature Set
Summary: Recipe for ORA
- Define feature list (e.g. thresholding analyzed list ) and background list,
- Select feature sets to test for enrichment,
- Run enrichment tests and adjust for multiple testing
- Interpret your enrichments
- Publish! ;)
Posible problems with ORA
- No “natural” value for the threshold
- Possible loss of statistical power due to thresholding
- No resolution between significant signals with different strengths
- Weak signals neglected
- Different results at different threshold settings
- Based on the wrong assumption of independent feature (or feature group) sampling, which increases false positive predictions.
Functional Class Scoring
Also known as:
Analysis of ranked lists
Metabolite Set Enrichment Analysis
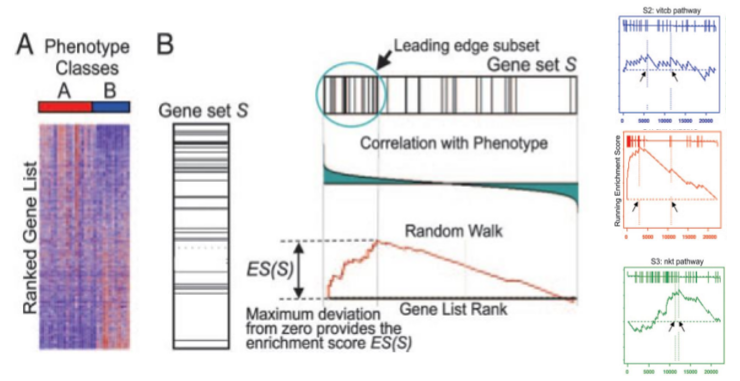
Rooted in the Gene Set Enrichment Analysis (GSEA) method developed to overcome ORA limitations.

The GSEA Method (1)
GSEA method compares, for each feature set, the distribution of the test statistic within the set with the overall distribution of those statistics, i.e. the calculated for all genes.
To do this, test statistics are ranked (from biggest to smallest) and for gene set a running sum is computed such that
- If a feature is in the set add a certain quantity (\(\sqrt{(N-N_s)/N_s}\))
- If a feature is not in the set, substract a (small) quantity (\(\sqrt{N_s/(N-N_s)}\))
The GSEA tests
If the distribution of the running sum doesn’t differ from a random walk then the list can be declared significantly enriched in that set.
Original test was a Kolmogorov-Smirnov test (K-S test) statistic with P-values computed by randomization.
![]()
GSEA Extensions/Alternatives
Wilcoxon test:
I uses rank-based methods to assess whether the feature sets are distributed differently across the groups.Globaltest:
- It evaluates the association between a predefined set of features and a clinical outcome of interest.
- Instead of testing individual features, it assesses the global effect of the gene set on the outcome.
- This method is beneficial in identifying pathways or feature sets that have a combined influence on a phenotype, rather than relying on individual feature-level analysis.
PWA for untargeted studies
What to do when you don’t know what the metabolites ions are?
Most popular option is Mummichog (Li et al. 2013).

Mummichog pathway mapping
- Ions are divided into significant and non-significant groups.
- E.g 1000 ions,150 with p-val <0.05
- Repeat many times
- Randomly take 150 of the remaining non-significant ions and mapped onto known pathways.
- This provides an estimate of how likely it is to observe random association of non-significant ions with pathways.
- The significant ions are now mapped to the pathways and evidence is sought for enhanced associations (Fisher exact test)
Mummichog change of approach
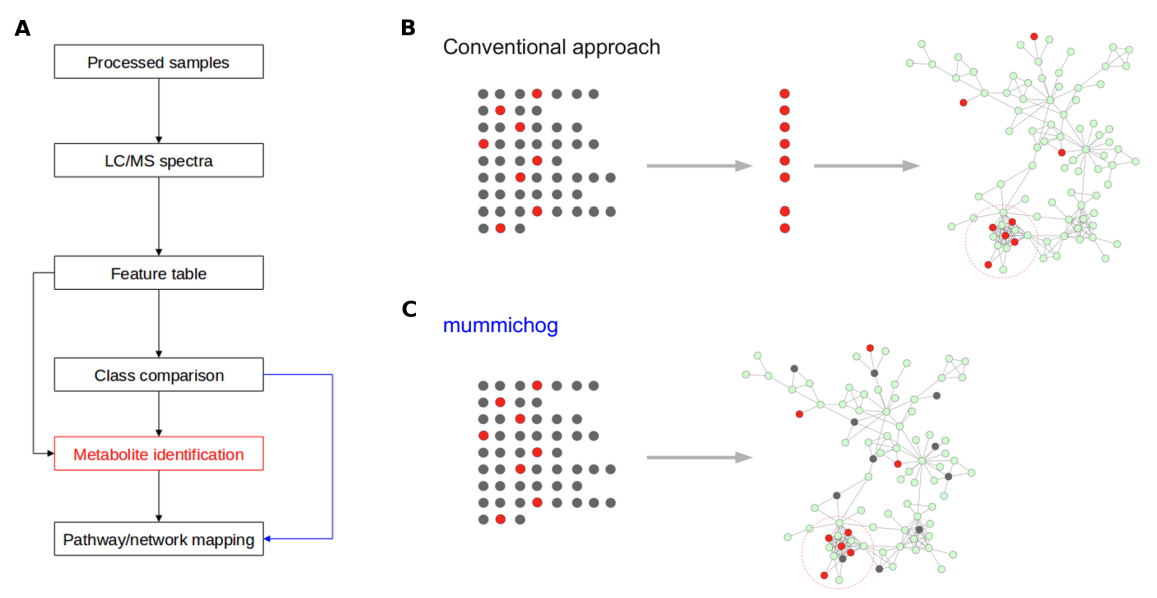
Mummichog redefines the work flow of untargeted metabolomics
Multiple testing problem and adjustments
Multiple testing
Whatever approach we use for pathway Analysis there is a common characteristic: Every test is applied for every feature set in a long collection of sets
This leads to a multiple testing problem: the Type I error probability of falsely rejecting the null hypothesis increases with the number of tests.
In order to avoid an artificial inflation of False positive discoveries some adjustments are recommended.
Hypothesis Tests Decision Table
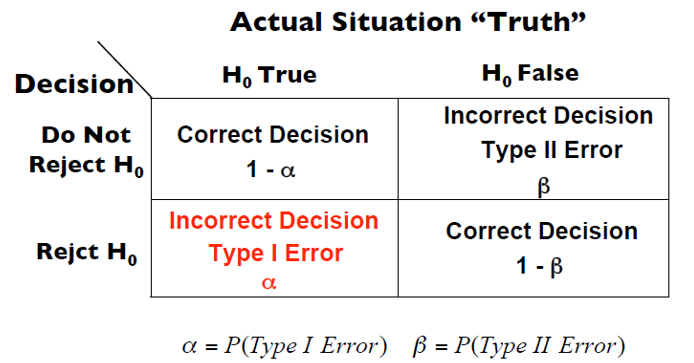
In a test with a null and an alternative hypothesis there are 2 possible right decisions and two possible incorrect ones (Type I and Type II errors)
Why Multiple testing matters
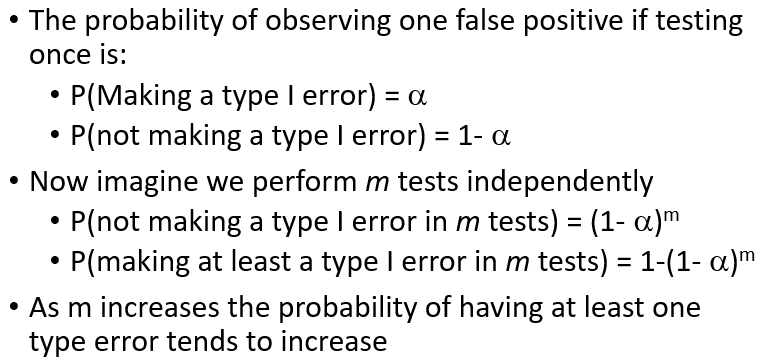
TYpe I error not useful here
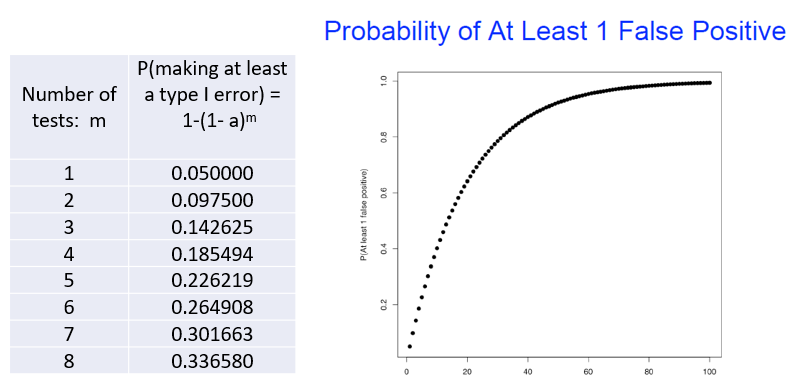
How to deal with this issue?
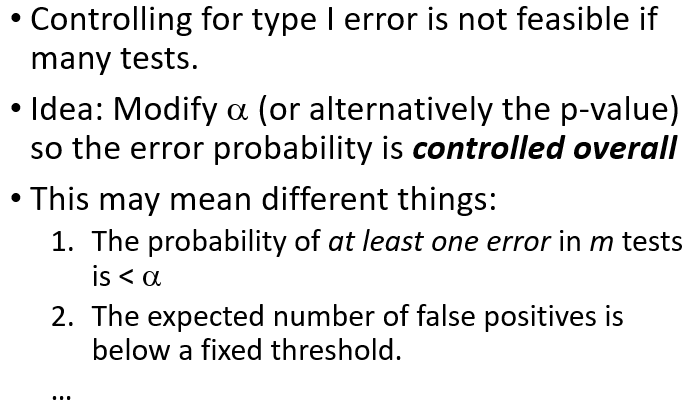
Family Wise Error Rate
Let \(M\) be the number of annotations tested.
Given p-value, \(p\) compute \(p_{adj}=p\times M\), or
Given significance level \(\alpha\) compute \(\alpha_{adj}=\alpha/M\).
The adjusted P-value, \(p_{adj}\) is greater than or equal to the probability that one or more of the observed enrichments are due to random draws.
This adjustment is said to controling for the Family-Wise Error Rate (FWER).
Bonferroni method controls FWER.
Bonferroni Caveats
This adjustment is very stringent and can “wash away” real enrichments leading to false negatives,
Often one is willing to accept a less stringent condition, that is accepting some false positives to avoid too many false negatives.
This is may be done using the “false discovery rate” (FDR), which leads to a gentler correction when there are real enrichments.
False Discovery Rate
- FDR is the expected proportion of “False Positives” that is of the observed enrichments due to chance.
- Less restrictive than Bonferroni adjustment which is a bound on the probability that any one of the observed enrichments could be due to random chance.
- Typically, FDR adjustments are calculated using the Benjamini-Hochberg procedure.
- FDR threshold is often called the “q-value”
An example
Limitations and Recommendations
Some limitations
Incomplete Pathway Databases
Metabolite Misidentification
Chemical Bias of Assays
Background Set Selection
Selection of Compounds of Interest
Multiple testing issues
Pathway Analysis Tools
PAthway Analysis Tools
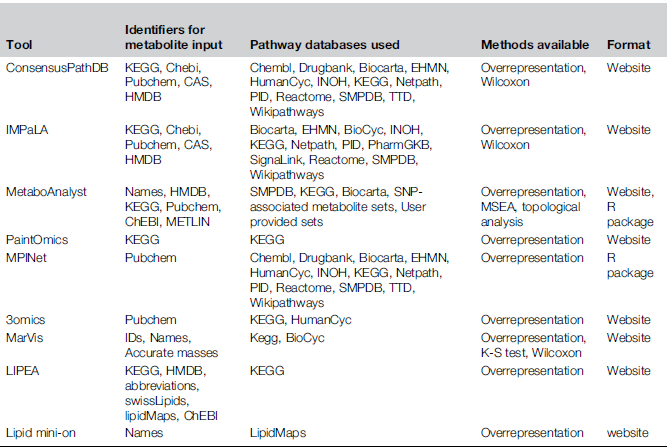
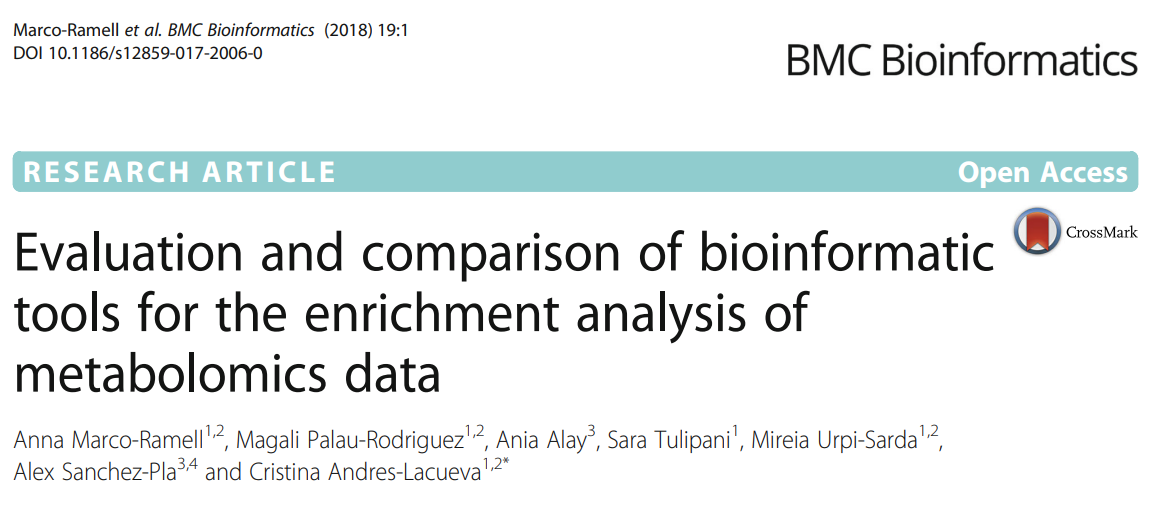
A comparison of tools
The space of tools (in 2017)
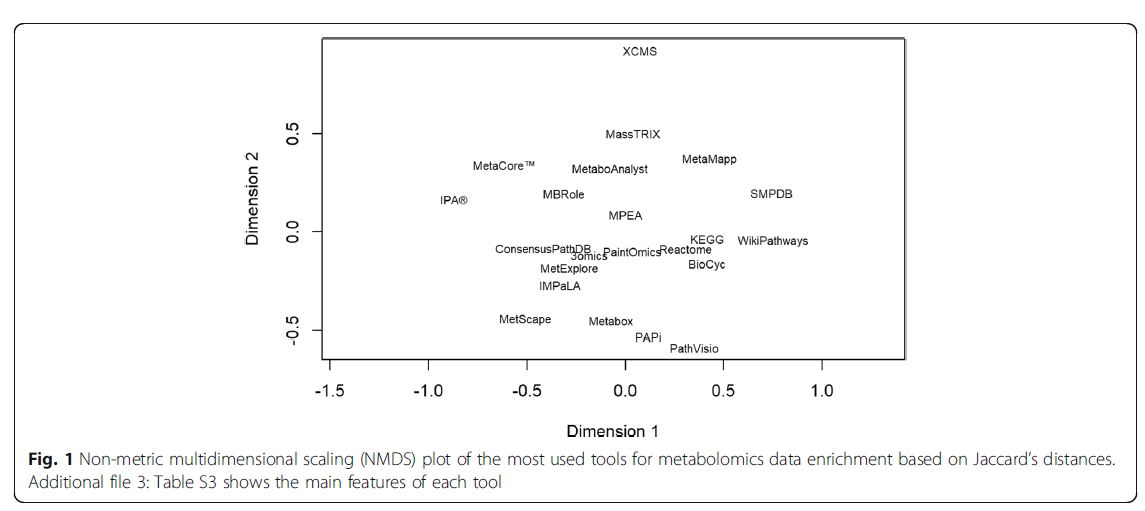
Not the same, not that different
ORA tools provided consistent results among tools revealing that these analyses are robust and reproducible regardless of their analytic approach.
Redundancy of identifiers, Use of chemical class identifiers and Incompleteness of databases sets limit the extent of the analyses and reduce their accuracy.
More work in the completeness of metabolite/pathway databases is required to get more accurate and global insights of the metabolome. # Summary, and all that
Summary
Pathway Analysis is a useful approach to help gain biological understanding from omics-based studies.
There are many ways, many methods, many tools
Guide the choice by a combination of meaning, availability, ease of use and usefulness.
Usually obtained from a good understanding of what it does and ow it is done.
Different methods may yield different results.
Worth checking!
